- Selected Major World Stock Market Indexes, Table
-
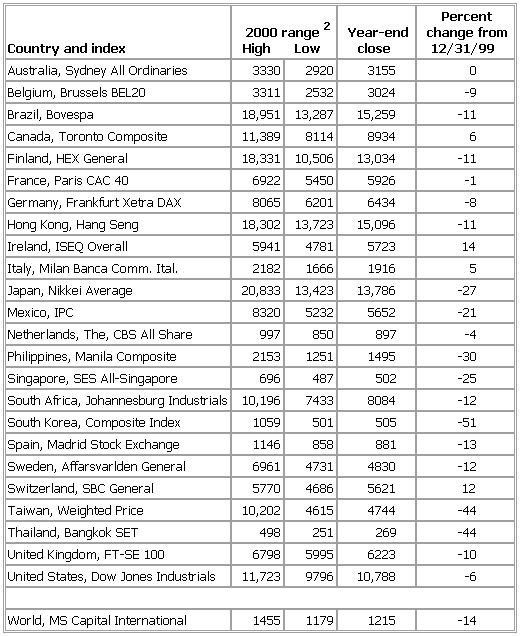
▪ 2001Table V. Selected Major WorldStock Market Indexes1Country and index 2000 range2change from12/31/99Australia, Sydney All Ordinaries 3330 2920 3155 0Belgium, Brussels BEL20 3311 2532 3024 -9Brazil, Bovespa 18,951 13,287 15,259 -11Canada, Toronto Composite 11,389 8114 8934 6Finland, HEX General 18,331 10,506 13,034 -11France, Paris CAC 40 6922 5450 5926 -1Germany, Frankfurt Xetra DAX 8065 6201 6434 -8Hong Kong, Hang Seng 18,302 13,723 15,096 -11Ireland, ISEQ Overall 5941 4781 5723 14Italy, Milan Banca Comm. Ital. 2182 1666 1916 5Japan, Nikkei Average 20,833 13,423 13,786 -27Mexico, IPC 8320 5232 5652 -21Netherlands, The, CBS All Share 997 850 897 -4Philippines, Manila Composite 2153 1251 1495 -30Singapore, SES All-Singapore 696 487 502 -25South Africa, Johannesburg Industrials 10,196 7433 8084 -12South Korea, Composite Index 1059 501 505 -51Spain, Madrid Stock Exchange 1146 858 881 -13Sweden, Affarsvarlden General 6961 4731 4830 -12Switzerland, SBC General 5770 4686 5621 12Taiwan, Weighted Price 10,202 4615 4744 -44Thailand, Bangkok SET 498 251 269 -44United Kingdom, FT-SE 100 6798 5995 6223 -10United States, Dow Jones Industrials 11,723 9796 10,788 -6World, MS Capital International 1455 1179 1215 -14See as table:
 1Index numbers are rounded.2Based on daily closing price.Source: Financial Times.▪ 2000Table V. Selected Major World Stock Market Indexes1Country and index 1999 range2change from12/31/98Australia, Sydney All Ordinaries 3153 2780 3153 12Belgium, Brussels BEL20 3692 2866 3340 -5Canada, Toronto Composite 8473 6180 8414 30Denmark, Copenhagen Stock Exchange 779 566 775 21Finland, HEX General 14,579 5680 14,579 162France, Paris CAC 40 5958 3959 5958 51Germany, Frankfurt FAZ Aktien 2164 1490 2164 36Hong Kong, Hang Seng 16,962 9076 16,962 69Ireland, ISEQ Overall 5438 4471 5018 0Italy, Milan Banca Comm. Ital. 1817 1397 1817 22Japan, Nikkei Average 18,934 13,233 18,934 37Mexico, IPC 7130 3300 7130 80Netherlands, The, CBS All Share 933 691 933 27Norway, Oslo Stock Exchange 2438 1653 2438 49Philippines, Manila Composite 2622 1892 2143 9Singapore, SES All-Singapore 669 351 669 75South Africa, Johannesburg Industrials 9212 6262 9213 47South Korea, Composite Index 1028 498 1028 83Spain, Madrid Stock Exchange 1013 824 1009 16Sweden, Affarsvarlden General 5550 3268 5500 66Switzerland, SBC General 5023 4362 5023 12Taiwan, Weighted Price 8609 5475 8449 32Thailand, Bangkok SET 546 314 482 35United Kingdom, FT-SE 100 6930 5770 6930 18United States, Dow Jones Industrials 11,497 9121 11,497 25World, MS Capital International 1411 1122 1411 23See as table:
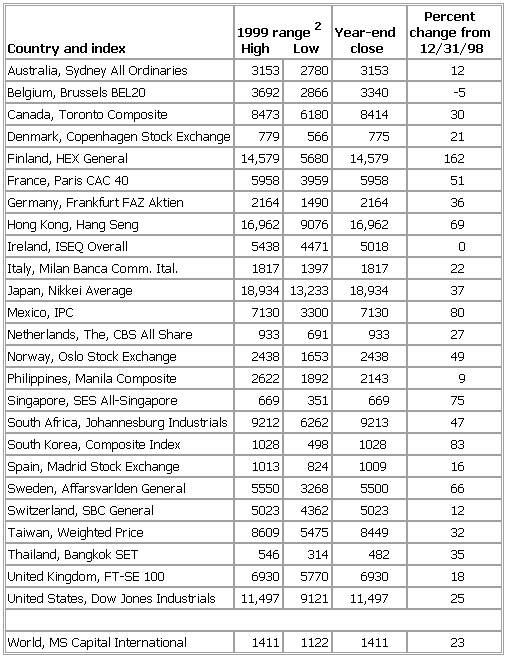 1Index numbers are rounded.2Based on daily closing price.Source: Financial Times.▪ 1999Table VI. Selected Major World Stock Market Indexes1Country and index 1998 range2change from12/31/97Australia, Sydney All Ordinaries 2881 2458 2813 7Austria, Credit Aktien 584 345 382 -16Belgium, Brussels BEL20 3632 2358 3515 45Canada, Toronto Composite 7822 5336 6486 -3Denmark, Copenhagen Stock Exchange 779 567 638 -6Finland, HEX General 5799 3220 5565 69France, Paris CAC 40 4388 2863 3943 31Germany, Frankfurt FAZ Aktien 1941 1251 1594 15Hong Kong, Hang Seng 11,811 6660 10,049 -6Ireland, ISEQ Overall 5471 3745 4996 23Italy, Milan Banca Comm. Ital. 1654 1064 1487 41Japan, Nikkei Average 17,264 12,880 13,842 -9Mexico, IPC 5204 2856 3960 -24Netherlands, The, CBS All Share 845 548 735 19Norway, Oslo Stock Exchange 2371 1360 1638 -22Philippines, Manila Composite 2311 1082 1969 5Singapore, SES All-Singapore 438 253 383 -10South Africa, Johannesburg Industrials 9943 5247 6264 -16South Korea, Composite Index 580 280 562 49Spain, Madrid Stock Exchange 948 642 868 37Sweden, Affarsvarlden General 3956 2412 3315 11Switzerland, SBC General 5237 3311 4497 15Taiwan, Weighted Price 9227 6251 6418 -22Thailand, Bangkok SET 559 207 356 -5United Kingdom, FT-SE 100 6179 4649 5883 15United States, Dow Jones Industrials 9374 7539 9181 16World, MS Capital International 1152 889 1149 23See as table:
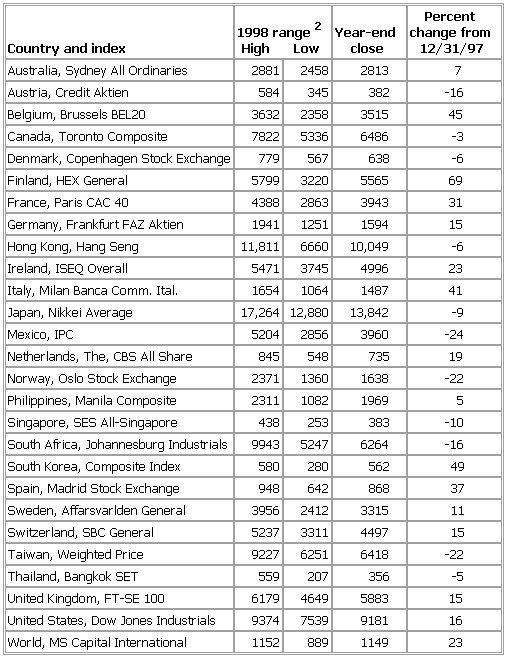 1Index numbers are rounded.2Based on daily closing price.Source: Financial Times.
* * *
▪ TableCountry and Index 2001 range2change from12/31/00Australia, Sydney All Ordinaries 3425 2867 3360 6Belgium, Brussels BEL20 3030 2323 2782 -8Brazil, Bovespa 17,889 10,006 13,578 -11Canada, Toronto Composite 9348 6513 7688 -14Denmark, KFX 348 236 272 -13Finland, HEX General 12,872 5584 8805 -32France, Paris CAC 40 5998 3653 4625 -22Germany, Frankfurt Xextra DAX 6795 3787 5160 -20Hong Kong, Hang Seng 16,164 8934 11,397 -25Ireland, ISEQ Overall 6458 4650 5673 -1Italy, Milan Banca Commerciale Italiana 1948 1083 1433 -25Japan, Nikkei Average 14,529 9504 10,543 -24Mexico, IPC 6869 5082 6372 13Netherlands, The, CBS All Share 906 557 708 -21Philippines, Manila Composite 1712 979 1168 -22Singapore, SES All-Singapore 515 335 426 -15South Africa, Johannesburg Industrials 8720 6155 7764 -4South Korea, Composite Index 705 469 694 37Spain, Madrid Stock Exchange 964 649 824 -6Switzerland, SBC General 5604 3547 4383 -22Taiwan, Weighted Price 6104 3446 5551 17Thailand, Bangkok SET 343 265 304 13United Kingdom, FT-SE 100 6335 4434 5217 -16United States, Dow Jones Industrials 11,338 8236 10,022 -7World, MS Capital International 1249 854 1009 -17See as table: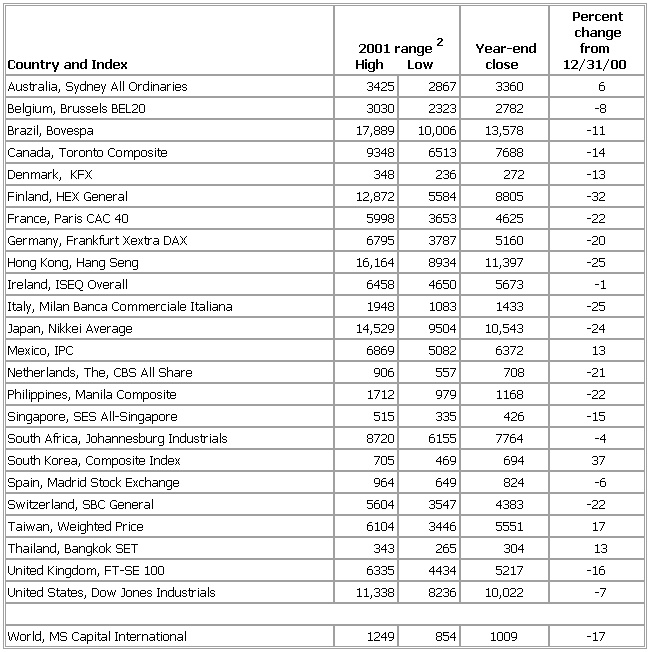 1Index numbers are rounded.2Based on daily closing price.Source: Financial Times.
* * *
Universalium. 2010.