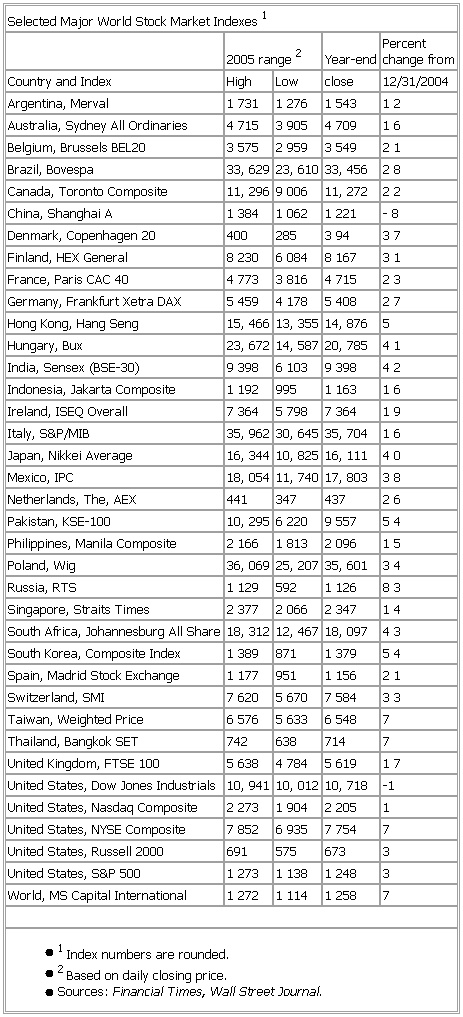
- Selected Major World Stock Market Indexes 1
-
▪ TableSelected Major World Stock Market Indexes12005 range2 Year-end Percentchange fromCountry and Index High Low close 12/31/2004Argentina, Merval 1731 1276 1543 12Australia, Sydney All Ordinaries 4715 3905 4709 16Belgium, Brussels BEL20 3575 2959 3549 21Brazil, Bovespa 33,629 23,610 33,456 28Canada, Toronto Composite 11,296 9006 11,272 22China, Shanghai A 1384 1062 1221 -8Denmark, Copenhagen 20 400 285 394 37Finland, HEX General 8230 6084 8167 31France, Paris CAC 40 4773 3816 4715 23Germany, Frankfurt Xetra DAX 5459 4178 5408 27Hong Kong, Hang Seng 15,466 13,355 14,876 5Hungary, Bux 23,672 14,587 20,785 41India, Sensex (BSE-30) 9398 6103 9398 42Indonesia, Jakarta Composite 1192 995 1163 16Ireland, ISEQ Overall 7364 5798 7364 19Italy, S&P/MIB 35,962 30,645 35,704 16Japan, Nikkei Average 16,344 10,825 16,111 40Mexico, IPC 18,054 11,740 17,803 38Netherlands, The, AEX 441 347 437 26Pakistan, KSE-100 10,295 6220 9557 54Philippines, Manila Composite 2166 1813 2096 15Poland, Wig 36,069 25,207 35,601 34Russia, RTS 1129 592 1126 83Singapore, Straits Times 2377 2066 2347 14South Africa, Johannesburg All Share 18,312 12,467 18,097 43South Korea, Composite Index 1389 871 1379 54Spain, Madrid Stock Exchange 1177 951 1156 21Switzerland, SMI 7620 5670 7584 33Taiwan, Weighted Price 6576 5633 6548 7Thailand, Bangkok SET 742 638 714 7United Kingdom, FTSE 100 5638 4784 5619 17United States, Dow Jones Industrials 10,941 10,012 10,718 -1United States, Nasdaq Composite 2273 1904 2205 1United States, NYSE Composite 7852 6935 7754 7United States, Russell 2000 691 575 673 3United States, S&P 500 1273 1138 1248 3World, MS Capital International 1272 1114 1258 7● 1Index numbers are rounded.● 2Based on daily closing price.● Sources: Financial Times, Wall Street Journal.See as table:

* * *
Universalium. 2010.
