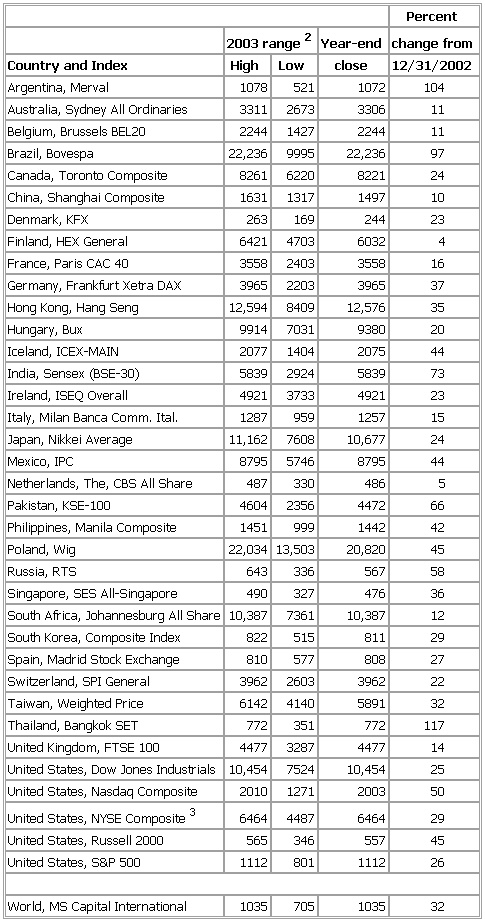
- Selected Major World Stock Market Indexes 6
-
▪ Table2003 range2 Year-end change fromArgentina, Merval 1078 521 1072 104Australia, Sydney All Ordinaries 3311 2673 3306 11Belgium, Brussels BEL20 2244 1427 2244 11Brazil, Bovespa 22,236 9995 22,236 97Canada, Toronto Composite 8261 6220 8221 24China, Shanghai Composite 1631 1317 1497 10Denmark, KFX 263 169 244 23Finland, HEX General 6421 4703 6032 4France, Paris CAC 40 3558 2403 3558 16Germany, Frankfurt Xetra DAX 3965 2203 3965 37Hong Kong, Hang Seng 12,594 8409 12,576 35Hungary, Bux 9914 7031 9380 20Iceland, ICEX-MAIN 2077 1404 2075 44India, Sensex (BSE-30) 5839 2924 5839 73Ireland, ISEQ Overall 4921 3733 4921 23Italy, Milan Banca Comm. Ital. 1287 959 1257 15Japan, Nikkei Average 11,162 7608 10,677 24Mexico, IPC 8795 5746 8795 44Netherlands, The, CBS All Share 487 330 486 5Pakistan, KSE-100 4604 2356 4472 66Philippines, Manila Composite 1451 999 1442 42Poland, Wig 22,034 13,503 20,820 45Russia, RTS 643 336 567 58Singapore, SES All-Singapore 490 327 476 36South Africa, Johannesburg All Share 10,387 7361 10,387 12South Korea, Composite Index 822 515 811 29Spain, Madrid Stock Exchange 810 577 808 27Switzerland, SPI General 3962 2603 3962 22Taiwan, Weighted Price 6142 4140 5891 32Thailand, Bangkok SET 772 351 772 117United Kingdom, FTSE 100 4477 3287 4477 14United States, Dow Jones Industrials 10,454 7524 10,454 25United States, Nasdaq Composite 2010 1271 2003 50United States, NYSE Composite3 6464 4487 6464 29United States, Russell 2000 565 346 557 45United States, S&P 500 1112 801 1112 26World, MS Capital International 1035 705 1035 32See as table:
 1Index numbers are rounded.2Based on daily closing price.3Index recalculated in January 2003 to a base value of 5000.Sources: Financial Times, The Wall Street Journal, www.hkex.com.hk.
* * *
Universalium. 2010.
