- Selected Major World Stock Market Indexes 2
-
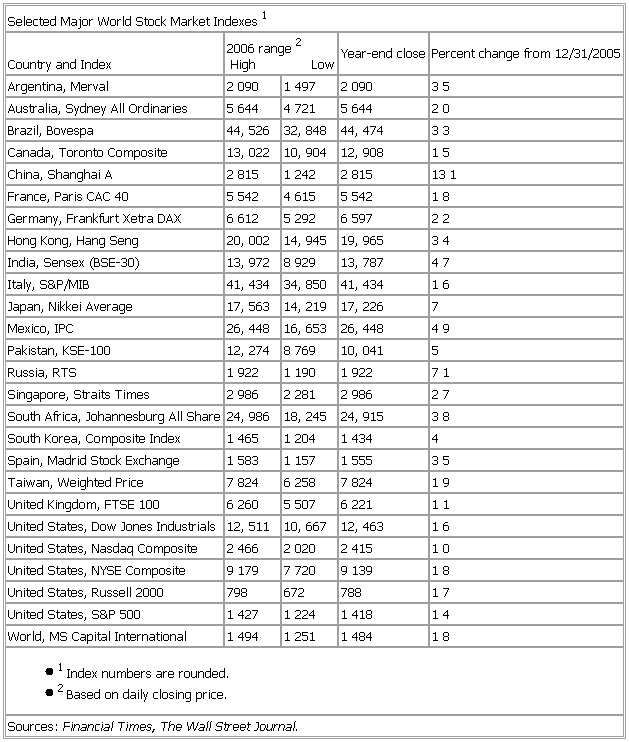
▪ TableSelected Major World Stock Market Indexes1Country and Index 2006 range2High Low Year-end close Percent change from 12/31/2005Argentina, Merval 2090 1497 2090 35Australia, Sydney All Ordinaries 5644 4721 5644 20Brazil, Bovespa 44,526 32,848 44,474 33Canada, Toronto Composite 13,022 10,904 12,908 15China, Shanghai A 2815 1242 2815 131France, Paris CAC 40 5542 4615 5542 18Germany, Frankfurt Xetra DAX 6612 5292 6597 22Hong Kong, Hang Seng 20,002 14,945 19,965 34India, Sensex (BSE-30) 13,972 8929 13,787 47Italy, S&P/MIB 41,434 34,850 41,434 16Japan, Nikkei Average 17,563 14,219 17,226 7Mexico, IPC 26,448 16,653 26,448 49Pakistan, KSE-100 12,274 8769 10,041 5Russia, RTS 1922 1190 1922 71Singapore, Straits Times 2986 2281 2986 27South Africa, Johannesburg All Share 24,986 18,245 24,915 38South Korea, Composite Index 1465 1204 1434 4Spain, Madrid Stock Exchange 1583 1157 1555 35Taiwan, Weighted Price 7824 6258 7824 19United Kingdom, FTSE 100 6260 5507 6221 11United States, Dow Jones Industrials 12,511 10,667 12,463 16United States, Nasdaq Composite 2466 2020 2415 10United States, NYSE Composite 9179 7720 9139 18United States, Russell 2000 798 672 788 17United States, S&P 500 1427 1224 1418 14World, MS Capital International 1494 1251 1484 18● 1Index numbers are rounded.● 2Based on daily closing price.Sources: Financial Times, The Wall Street Journal.See as table:

* * *
Universalium. 2010.
