Selected U.S. Stock Market Indexes
- Selected U.S. Stock Market Indexes
-
Selected U.S. Stock Market Indexes1
2001 range2
change from
12/31/00
Dow Jones Averages
30 Industrials 11,338 8236 10,022 -7
20 Transportation 3146 2034 2640 -10
15 Utilities 399 275 294 -29
65 Composite 3392 2489 2892 -13
Standard & Poor's
500 Index 1374 966 1148 -13
Industrials 1613 1113 1334 -13
Utilities 342 219 237 -32
Others
NYSE Composite 667 504 590 -10
Nasdaq Composite 2859 1423 1950 -21
Amex Composite 959 780 848 -6
Russell 2000 517 379 489 1
See as table: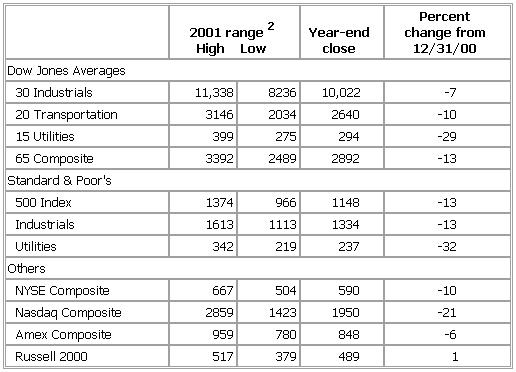
1Index numbers are rounded.
2Based on daily closing price.
* * *
Universalium.
2010.
Look at other dictionaries:
Selected Major World Stock Market Indexes — ▪ Table Selected Major World Stock Market Indexes1 2004 range2 Year end Percent change from Country and Index High Low close 12/31/2003 Argentina, Merval 1390 840 1375 28 Australia, Sydney All Ordinaries 4057 3275 4053 23 Belgium, Brussels BEL20… … Universalium
Selected Major World Stock Market Indexes 1 — ▪ Table Selected Major World Stock Market Indexes1 2005 range2 Year end Percent change from Country and Index High Low close 12/31/2004 Argentina, Merval 1731 1276 1543 12 Australia, Sydney All Ordinaries 4715 3905 4709 16 Belgium, Brussels BEL20 … Universalium
Selected Major World Stock Market Indexes 2 — ▪ Table Selected Major World Stock Market Indexes1 Country and Index 2006 range2 High Low Year end close Percent change from 12/31/2005 Argentina, Merval 2090 1497 2090 35 Australia, Sydney All Ordinaries 5644 4721 5644 20 Brazil,… … Universalium
Selected Major World Stock Market Indexes 3 — ▪ Table Selected Major World Stock Market Indexes1 Country and Index 2007 range2 High Low Year end close Percent change from 12/31/2006 Argentina, Merval 2351 1834 2152 3 Australia, Sydney All Ordinaries 6873 5482 6421 14 Brazil,… … Universalium
Selected Major World Stock Market Indexes 4 — ▪ Table Selected Major World Stock Market Indexes1 Country and Index 2008 range2 High Low Year end close Percent change from 12/31/2007 Argentina, Merval 2249 829 1080 −50 Australia, Sydney All Ordinaries 6434 3333 3659 −43 Brazil … Universalium
Selected Major World Stock Market Indexes, Table — ▪ 2001 Table V. Selected Major World Stock Market Indexes1 Country and index 2000 range2 High Low Year end close Percent change from 12/31/99 Australia, Sydney All Ordinaries 3330 2920 3155 0 Belgium, Brussels BEL20 3311 2532 … … Universalium
Selected U.S. Stock Market Indexes, Table — ▪ 2001 Table VI. Selected U.S. Stock Market Indexes1 2000 range2 High Low Year end close Percent change from 12/31/99 Dow Jones Averages 30 Industrials 11,723 9796 10,787 6 20 Transportation 2981 2264 2947 1 15 Utilities 416 274 … Universalium
Selected Major World Stock Market Indexes, Table 1 — ▪ Table Table VI. Selected Major World Stock Market Indexes1 Country and index 1997 range2 High Low Year end close Percent change from 12/31/96 Australia, Sydney All Ordinaries 2779 2299 2617 8 Austria, Credit Aktien 474 374 … … Universalium
Selected Major World Stock Market Indexes 6 — ▪ Table Percent 2003 range2 Year end change from Country and Index High Low close 12/31/2002 Argentina, Merval 1078 521 1072 104 Australia, Sydney All Ordinaries 3311 2673 3306 11 Belgium, Brussels BEL20 2244 1427 2244 11 Brazil, Bovespa… … Universalium
Selected Major World Stock Market Indexes 5 — ▪ Table Percent 2002 range2 Year end change from Country and Index High Low close 12/31/2001 Australia, Sydney All Ordinaries 3440 2856 2976 11 Belgium, Brussels BEL20 2900 1774 2025 27 Brazil, Bovespa 14,471 8371 11,268 17 Canada, Toronto… … Universalium