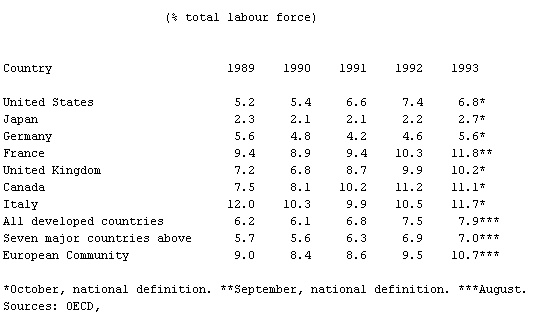
- Standardized Unemployment Rates in Selected Developed Countries, Table 4
-
▪ Table(% total labour force)Country 1989 1990 1991 1992 1993United States 5.2 5.4 6.6 7.4 6.8*Japan 2.3 2.1 2.1 2.2 2.7*Germany 5.6 4.8 4.2 4.6 5.6*France 9.4 8.9 9.4 10.3 11.8**United Kingdom 7.2 6.8 8.7 9.9 10.2*Canada 7.5 8.1 10.2 11.2 11.1*Italy 12.0 10.3 9.9 10.5 11.7*All developed countries 6.2 6.1 6.8 7.5 7.9***Seven major countries above 5.7 5.6 6.3 6.9 7.0***European Community 9.0 8.4 8.6 9.5 10.7****October, national definition. **September, national definition. ***August.Sources: OECD,
 Main Economic Indicators, October 1993; The Economist.
* * *
Universalium. 2010.
