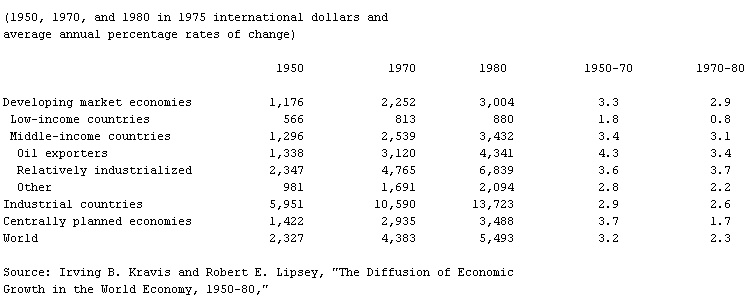
- Real Gross Domestic Product per Economically Active Person, Table
-
▪ Table(1950, 1970, and 1980 in 1975 international dollars andaverage annual percentage rates of change)1950 1970 1980 1950-70 1970-80Developing market economies 1,176 2,252 3,004 3.3 2.9Low-income countries 566 813 880 1.8 0.8Middle-income countries 1,296 2,539 3,432 3.4 3.1Oil exporters 1,338 3,120 4,341 4.3 3.4Relatively industrialized 2,347 4,765 6,839 3.6 3.7Other 981 1,691 2,094 2.8 2.2Industrial countries 5,951 10,590 13,723 2.9 2.6Centrally planned economies 1,422 2,935 3,488 3.7 1.7World 2,327 4,383 5,493 3.2 2.3Growth in the World Economy, 1950-80,"
 International Comparisons of Productivity and Causes of the Slowdown, ed. by John W. Kendrick (1984),Table 3-A3, p. 145. The 1980 estimates assume that labour force participationratios in 1980 were the same as in 1975. Reprinted with the permission ofThe American Enterprise Institute for Public Policy Research, Washington, D.C.
* * *
Universalium. 2010.
