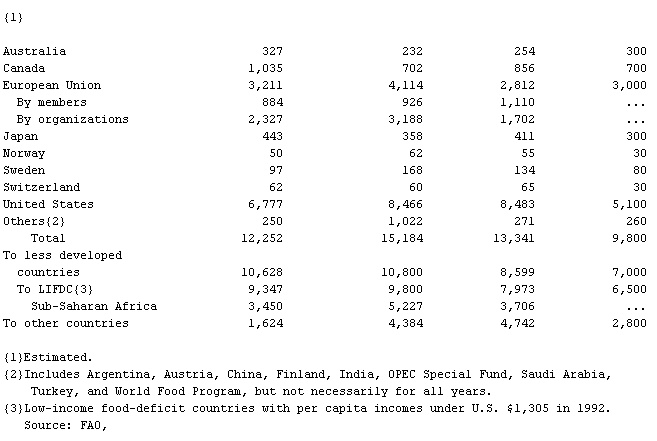
- Shipment of Food Aid in Cereals, Table 1
-
▪ TableIn 000-metric ton grain equivalentRegion and country 1989-90, 1991-92 1992-93 1993-94 1994-95{1}Australia 327 232 254 300Canada 1,035 702 856 700European Union 3,211 4,114 2,812 3,000By members 884 926 1,110 ...By organizations 2,327 3,188 1,702 ...Japan 443 358 411 300Norway 50 62 55 30Sweden 97 168 134 80Switzerland 62 60 65 30United States 6,777 8,466 8,483 5,100Others{2} 250 1,022 271 260Total 12,252 15,184 13,341 9,800To less developedcountries 10,628 10,800 8,599 7,000To LIFDC{3} 9,347 9,800 7,973 6,500Sub-Saharan Africa 3,450 5,227 3,706 ...To other countries 1,624 4,384 4,742 2,800{1}Estimated.{2}Includes Argentina, Austria, China, Finland, India, OPEC Special Fund, Saudi Arabia,Turkey, and World Food Program, but not necessarily for all years.{3}Low-income food-deficit countries with per capita incomes under U.S. $1,305 in 1992.Source: FAO,
 Food Outlook, November-December 1994.
 * * *
Universalium. 2010.
