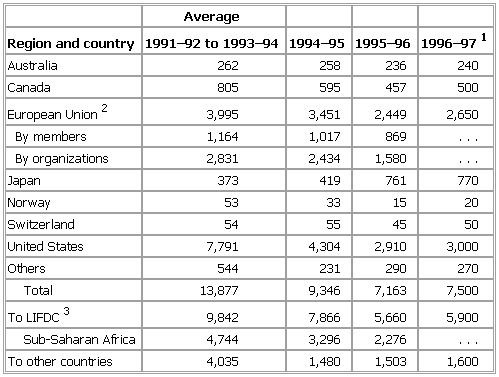
- Shipment of Food Aid in Cereals, Table 3
-
▪ TableTable II. Shipment of Food Aid in CerealsIn 000-metric ton grain equivalentRegion and country 1991–92 to 1993–94 1994–95 1995–96 1996–971Australia 262 258 236 240Canada 805 595 457 500European Union2 3,995 3,451 2,449 2,650By members 1,164 1,017 869 . . .By organizations 2,831 2,434 1,580 . . .Japan 373 419 761 770Norway 53 33 15 20Switzerland 54 55 45 50United States 7,791 4,304 2,910 3,000Others 544 231 290 270Total 13,877 9,346 7,163 7,500To LIFDC3 9,842 7,866 5,660 5,900Sub-Saharan Africa 4,744 3,296 2,276 . . .To other countries 4,035 1,480 1,503 1,600See as table:
 1Estimated, partly on the basis of minimum commitments under the Food Aid Convention of 1995.2Shows contribution of 15 member countries for all years.3Low-income food-deficit countries with per capita incomes under U.S. $1,395 in 1994.
* * *
Universalium. 2010.
