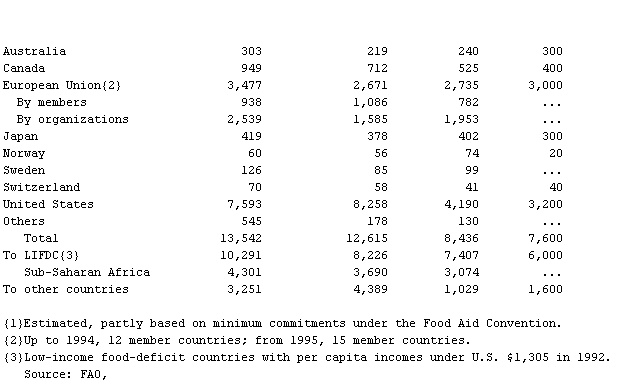
- Shipment of Food Aid in Cereals, Table 2
-
▪ TableIn 000-metric ton grain equivalentAverageRegion and country 1990-91 to 1992-93 1993-94 1994-95 1995-96{1}
 Australia 303 219 240 300Canada 949 712 525 400European Union{2} 3,477 2,671 2,735 3,000By members 938 1,086 782 ...By organizations 2,539 1,585 1,953 ...Japan 419 378 402 300Norway 60 56 74 20Sweden 126 85 99 ...Switzerland 70 58 41 40United States 7,593 8,258 4,190 3,200Others 545 178 130 ...Total 13,542 12,615 8,436 7,600To LIFDC{3} 10,291 8,226 7,407 6,000Sub-Saharan Africa 4,301 3,690 3,074 ...To other countries 3,251 4,389 1,029 1,600{1}Estimated, partly based on minimum commitments under the Food Aid Convention.{2}Up to 1994, 12 member countries; from 1995, 15 member countries.{3}Low-income food-deficit countries with per capita incomes under U.S. $1,305 in 1992.Source: FAO,
 Food Outlook, August-September 1995.
 * * *
Universalium. 2010.
