- Shipment of Food Aid in Cereals, Table
-
▪ 2001Table II. Shipment of Food Aidin Cereals1In 000,000 metric tonsRegion and country 1996-97 1997-98 1998-99 1999-2000Australia 170 296 267 264Canada 373 384 332 349European Union 1,099 890 1,572 1,324Japan 292 356 936 303Norway 32 45 65 48Switzerland 43 42 37 40United States 2,273 2,787 6,390 6,693Others 1,323 1,441 1,435 1,207Total 5,605 6,241 11,034 10,228To LIFDC2 4,487 5,267 7,908 6,779Sub-Saharan Africa 1,871 2,172 2,532 2,555To other countries 1,118 974 3,126 3,449See as table:
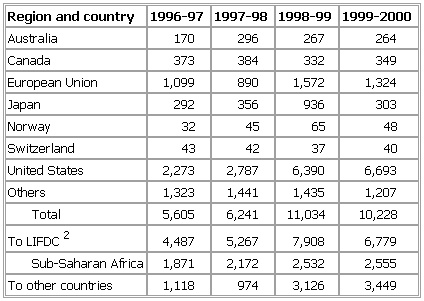 1July-June years.2Low-income food-deficit countries.Source: World Wide Web site for UN Food and AgricultureOrganization:▪ 1999Table II. Shipment of Food Aidin CerealsIn 000-metric ton grain equivalentRegion and country 1994-95 1995-96 1996-97 1997-981Australia 258 181 169 240Canada 602 436 373 349China 0 1 171 90European Union 2,488 1,731 1,073 861Japan 398 821 281 302Norway 34 14 32 44Switzerland 54 35 43 41United States 4,321 3,037 2,022 2,256Others 1,288 1,141 1,134 1,161Total 9,443 7,397 5,298 5,344To LIFDC2 7,910 6,400 4,447 4,838Sub-Saharan Africa 3,348 2,305 1,770 1,912To other countries 1,533 997 851 3,232See as table:
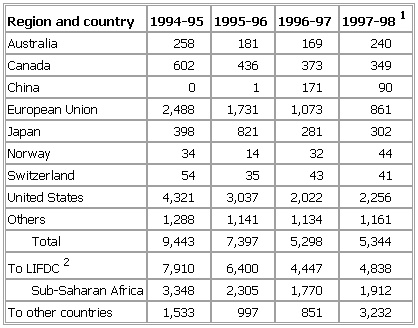 1Estimate partly based on minimum commitments under the Food AidConvention and budgetary allocations.2Low-income food-deficit countries.Source: UN Food and Agriculture Organization, October 1998.
* * *
▪ TableTable II. Shipment of Food Aidin CerealsIn 000-metric ton grain equivalentRegion and country Average1992-93 to 1994-95 1995-96 1996-97 1997-981Australia 238 238 272 250Canada 674 463 349 300China 6 0 111 100European Union 3,740 2,730 1,596 1,500By individual countries 1,145 940 717 . . .By the Union 2,595 1,790 879 . . .Japan 375 845 238 300Norway 41 19 25 20Switzerland 58 47 31 30United States 6,976 3,094 2,019 2,300Others 420 307 186 200Total 12,528 7,743 4,872 5,000To LIFDC2 8,638 6,700 4,116 4,200Sub-Saharan Africa 4,176 2,402 1,641 1,700To other countries 3,890 1,043 756 800See as table: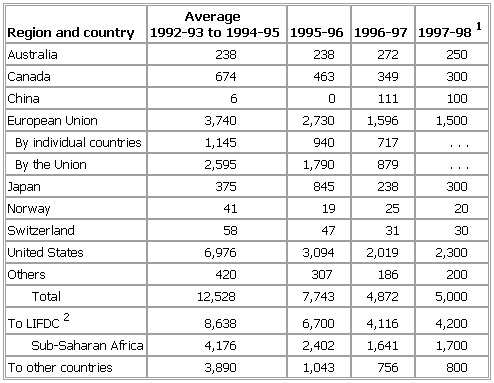 1Estimate partly based on minimum commitments under the Food AidConvention of 1995 and budgetary allocations.2Low-income food-deficit countries with per capita incomes under U.S.$1,395 in 1994.
* * *
Universalium. 2010.