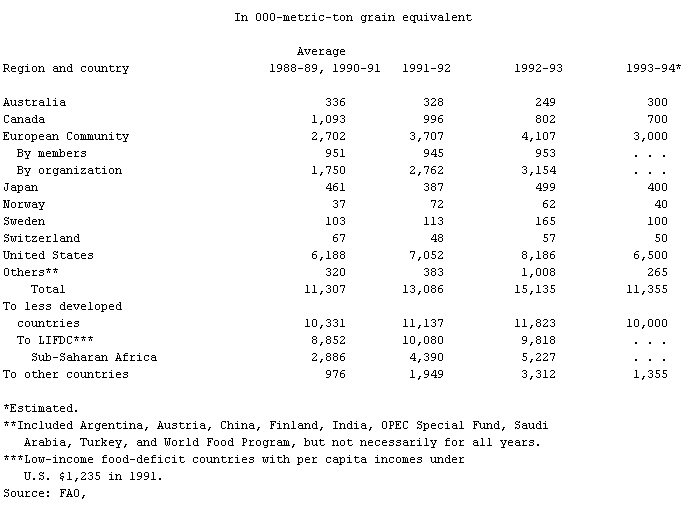
- Shipment of Food Aid in Cereals, Table 4
-
▪ TableIn 000-metric-ton grain equivalentAverageRegion and country 1988-89, 1990-91 1991-92 1992-93 1993-94*Australia 336 328 249 300Canada 1,093 996 802 700European Community 2,702 3,707 4,107 3,000By members 951 945 953 . . .By organization 1,750 2,762 3,154 . . .Japan 461 387 499 400Norway 37 72 62 40Sweden 103 113 165 100Switzerland 67 48 57 50United States 6,188 7,052 8,186 6,500Others** 320 383 1,008 265Total 11,307 13,086 15,135 11,355To less developedcountries 10,331 11,137 11,823 10,000To LIFDC*** 8,852 10,080 9,818 . . .Sub-Saharan Africa 2,886 4,390 5,227 . . .To other countries 976 1,949 3,312 1,355*Estimated.**Included Argentina, Austria, China, Finland, India, OPEC Special Fund, SaudiArabia, Turkey, and World Food Program, but not necessarily for all years.***Low-income food-deficit countries with per capita incomes underU.S. $1,235 in 1991.Source: FAO,
 Food Outlook, December 1993.
 * * *
Universalium. 2010.
