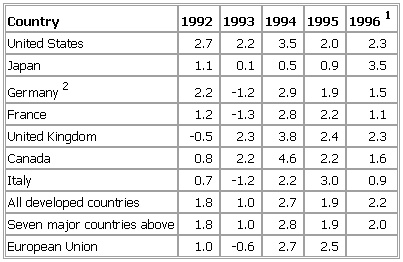
- Real Gross Domestic Products of Selected OECD Countris, Table
-
▪ Table% annual changeUnited States 2.7 2.2 3.5 2.0 2.3Japan 1.1 0.1 0.5 0.9 3.5Germany2 2.2 -1.2 2.9 1.9 1.5France 1.2 -1.3 2.8 2.2 1.1United Kingdom -0.5 2.3 3.8 2.4 2.3Canada 0.8 2.2 4.6 2.2 1.6Italy 0.7 -1.2 2.2 3.0 0.9All developed countries 1.8 1.0 2.7 1.9 2.2Seven major countries above 1.8 1.0 2.8 1.9 2.0European Union 1.0 -0.6 2.7 2.5See as table:
 1Estimated. 2From 1992, figures include former East Germany.
* * *
Universalium. 2010.
