Real Gross Domestic Products of Selected OECD Countries, Table 2
- Real Gross Domestic Products of Selected OECD Countries, Table 2
-
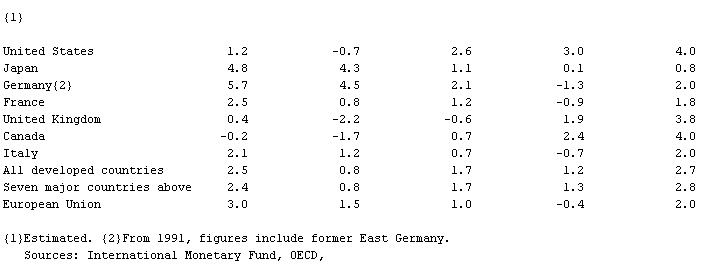
% annual change
Country 1990 1991 1992 1993 1994{1}
United States 1.2 -0.7 2.6 3.0 4.0
Japan 4.8 4.3 1.1 0.1 0.8
Germany{2} 5.7 4.5 2.1 -1.3 2.0
France 2.5 0.8 1.2 -0.9 1.8
United Kingdom 0.4 -2.2 -0.6 1.9 3.8
Canada -0.2 -1.7 0.7 2.4 4.0
Italy 2.1 1.2 0.7 -0.7 2.0
All developed countries 2.5 0.8 1.7 1.2 2.7
Seven major countries above 2.4 0.8 1.7 1.3 2.8
European Union 3.0 1.5 1.0 -0.4 2.0
{1}Estimated. {2}From 1991, figures include former East Germany.
* * *
Universalium.
2010.
Look at other dictionaries:
Real Gross Domestic Products of Selected OECD Countries, Table 3 — ▪ Table Table I. Real Gross Domestic Products of Selected OECD Countries % annual change Country 1993 1994 1995 1996 19971 United States 2.3 3.5 2.0 2.4 3.6 Japan 0.3 0.6 1.4 3.6 0.9 Germany 1.1 2.9 1.9 1.4 2.4 France 1.3 2.8 2.1 1.5 2.3… … Universalium
Real Gross Domestic Products of Selected OECD Countries, Table — ▪ 2001 Table I. Real Gross Domestic Products of Selected OECD Countries % annual change Country 1996 1997 1998 1999 20001 United States 3.6 4.4 4.4 4.2 5.2 Japan 5.1 1.6 2.5 0.2 1.9 Germany 0.8 1.4 2.1 1.6 3.0 France 1.1 1.9 3.2 2.9 3.3… … Universalium
Real Gross Domestic Products of Selected OECD Countris, Table — ▪ Table Table I. Real Gross Domestic Products of Selected OECD Countries % annual change Country 1992 1993 1994 1995 19961 United States 2.7 2.2 3.5 2.0 2.3 Japan 1.1 0.1 0.5 0.9 … … Universalium
Real Gross Domestic Products of Selected OECD Countries — ▪ Table Real Gross Domestic Products of Selected OECD Countries % annual change Country 1997 1998 1999 2000 20011 United States 4.4 4.3 4.1 4.1 1.3 Japan 1.9 1.1 0.8 1.5 0.5 Germany 1.4 2.0 1.8 3.0 0.8 France 1.9 3.5 3.0 3.4 2.0 Italy… … Universalium
Real Gross Domestic Products of Selected OECD Countries, Table 1 — ▪ Table % annual change Country 1989 1990 1991 1992 1993* United States 2.5 1.2 0.7 2.6 2.8 Japan 4.7 4.8 4.0 1.3 0 Germany** 3.6 5.7 1.7 1.9 2.3 France 4.3 2.5 0.7 1.4 1.1 United Kingdom 2.1 0.4 2.2 0.5 1.8 Canada 2.4 0.2 1.7 0.7 2.7 Italy 2.9 2 … Universalium
Real Gross Domestic Products of Selected Developed Countries 1 — ▪ Table Real Gross Domestic Products of Selected OECD Countries % annual change Country 2001 2002 2003 2004 20051 United States 0.8 1.6 2.7 4.2 3.55 Japan 0.2 0.3 1.4 2.7 2.05 Germany 1.2 0.1 0.2 1.6 0.85 France 2.1 1.3 0.9 2.0 1.55 Italy 1.8 0.4 … Universalium
Real Gross Domestic Products of Selected Developed Countries 2 — ▪ Table % annual change Country 1999 2000 2001 2002 20031 United States 4.1 3.8 0.3 2.4 2.6 Japan 0.2 2.8 0.4 0.2 2.0 Germany 2.0 2.9 0.8 0.2 0.0 France 3.2 4.2 2.1 1.2 0.5 Italy 1.7 3.1 1.8 0.4 0.4 United Kingdom 2.4 3.1 2.1 1.9 1.7 Canada 5.5 … Universalium
Real Gross Domestic Products of Selected Developed Countries 3 — ▪ Table % annual change Country 1998 1999 2000 2001 20021 United States 4.3 4.1 3.8 0.3 2.2 Japan 1.2 0.8 2.4 0.3 0.5 Germany 2.0 2.0 2.9 0.6 0.5 France 3.5 3.2 4.2 1.8 1.2 Italy 1.8 1.6 2.9 1.8 0.7 United Kingdom 2.9 2.4 3.1 1.9 1.7 Canada 4.1 … Universalium
Gross domestic product — GDP redirects here. For other uses, see GDP (disambiguation). Not to be confused with Gross national product or Gross domestic income. CIA World Factbook 2005 figures of total nominal GDP (top) compared to PPP adjusted GDP (bottom) … Wikipedia
Economic Affairs — ▪ 2006 Introduction In 2005 rising U.S. deficits, tight monetary policies, and higher oil prices triggered by hurricane damage in the Gulf of Mexico were moderating influences on the world economy and on U.S. stock markets, but some other… … Universalium
 The Economist.