- Livestock Inventories and Meat Production in Major Producing Countries, Table 1
-
▪ TableTable V. Livestock Inventories and Meat Production in Major Producing CountriesIn 000,000 head and 000,000 metric tons (carcass weight)Region and country 19951 19962 1995 19961Cattle and buffalo Beef and vealWorld total . . . . . . 55.3 56.5Canada 13 13 0.9 1.0United States 104 102 11.6 11.8Mexico 28 27 1.9 1.8Argentina 54 52 2.6 2.6Brazil 152 153 4.7 5.0Uruguay 10 11 0.3 0.4European Union 83 83 7.8 7.3Eastern Europe4 13 13 1.0 1.0Kazakstan 7 5 0.5 0.5Russia 40 37 2.8 2.6Ukraine 18 16 1.2 1.0Australia 27 27 1.7 1.8India 276 277 1.2 1.3China 124 128 4.2 4.4Hogs3 PorkWorld total . . . . . . 81.8 83.9Canada 12 12 1.3 1.2United States 58 57 8.1 7.8Mexico 11 10 1.0 1.0European Union 114 114 15.4 15.2Eastern Europe5 39 37 3.3 3.6Russia 23 21 1.9 1.7Ukraine 13 13 0.8 0.8Japan 10 10 1.3 1.3China 441 409 36.5 36.4Taiwan 10 11 1.2 1.3Poultry meatWorld total4 . . . . . . 53.9 56.5United States . . . . . . 13.8 14.6Mexico . . . . . . 1.1 1.1Brazil . . . . . . 4.1 4.1European Union . . . . . . 7.7 7.9Eastern Europe6 . . . . . . 0.9 0.9Russia . . . . . . 0.9 0.8Ukraine . . . . . . 0.2 0.2Japan . . . . . . 1.3 1.3China . . . . . . 9.3 11.0Sheep, goat meatWorld total . . . . . . 10.3 10.6All meatTotal4 . . . . . . 205.0 211.4See as table:
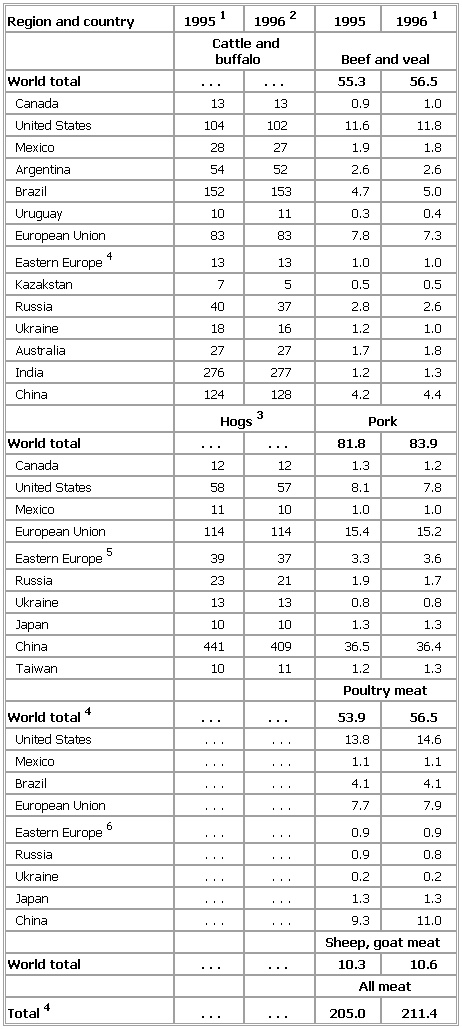 1Preliminary. 2Forecast. 3Livestock members at year's end. 4Bulgaria,Czech Republic, Poland, and Romania. 5Bulgaria, Czech Republic,Hungary, Poland, and Romania. 6Hungary, Poland, and Romania.
* * *
Universalium. 2010.