- Livestock Inventories and Meat Production in Major Producing Countries, Table
-
▪ 1999Table V. Livestock Inventories and Meat Production in Major Producing CountriesIn 000,000 head and 000,000 metric tons (carcass weight)Region and country 19971 19982 1997 19981Cattle and buffalo3 Beef and vealWorld total4 1,502 1,499 53.9 54.0Canada 13 13 1.1 1.1United States 101 97 11.7 11.8Mexico 26 25 1.8 1.8Argentina 50 51 2.6 2.2Brazil 145 143 6.1 6.1European Union 854 844 7.8 7.6Eastern Europe 13 12 1.44 1.34Russia 32 28 2.3 2.0Ukraine 14 12 0.9 0.9Australia 26 25 1.9 1.9India 303 307 1.4 1.6China 147 NA5 5.4 5.8Hogs PorkWorld total4 937 956 81.7 86.6Canada 12 12 1.3 1.3United States 61 62 7.8 8.5Mexico 11 11 0.9 1.0European Union 1204 1194 16.2 16.8Eastern Europe 36 37 4.24 4.84Russia 17 17 1.6 1.4Ukraine 10 10 0.7 0.7Japan 10 10 1.3 1.3China 475 NA5 42.5 44.0Taiwan 8 7 1.0 0.9Poultry meatWorld total4 . . . . . . 59.9 61.4United States . . . . . . 15.0 15.1Mexico . . . . . . 1.6 1.7Brazil . . . . . . 4.6 4.6European Union . . . . . . 8.2 8.4Eastern Europe . . . . . . 1.7 1.7Russia . . . . . . 0.6 0.6Ukraine . . . . . . 0.2 0.2Japan . . . . . . 1.2 1.2China . . . . . . 11.2 11.7Sheep, goat meatWorld total4 . . . . . . 11.1 11.3All meatTotal4 . . . . . . 215.3 220.4See as table:
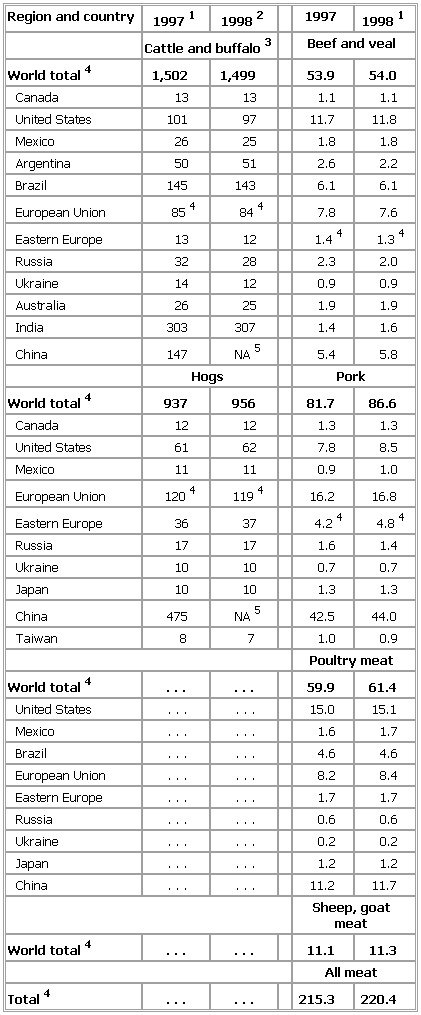 1Preliminary.2Forecast.3Livestock numbers at year's end.4UN Food and Agriculture Organization, December 1998.5Not available.Sources: Country data: U.S. Department of Agriculture,
* * *
▪ TableTable V. Livestock Inventories and Meat Production in Major Producing CountriesIn 000,000 head and 000,000 metric tons (carcass weight)Region and country 19961 19972 1996 19971Cattle and buffalo3 Beef and vealWorld total . . . . . . 56.9 57.6Canada 13 13 1.0 1.0United States 101 99 11.6 11.5Mexico 27 26 1.8 1.8Argentina 52 50 2.6 2.6Brazil 144 146 6.2 6.0European Union 83 82 7.8 7.6Eastern Europe4 13 13 1.0 1.0Russia 36 34 2.6 2.3Ukraine 15 14 1.2 0.9Australia 26 26 1.6 1.7India 277 279 1.3 1.3China 140 147 4.9 5.4Hogs PorkWorld total . . . . . . 86.9 91.4Canada 12 12 1.2 1.3United States 56 60 7.8 7.7Mexico 10 10 0.9 0.9European Union 117 113 16.2 16.0Eastern Europe5 37 37 3.5 3.4Russia 19 17 1.7 1.5Ukraine 11 10 0.8 0.8Japan 10 10 1.3 1.3China 457 475 40.4 42.5Taiwan 11 7 1.3 1.0Poultry meatWorld total . . . . . . 58.4 62.6United States . . . . . . 14.5 15.0Mexico . . . . . . 1.6 1.7Brazil . . . . . . 4.3 4.4European Union . . . . . . 8.1 8.3Eastern Europe6 . . . . . . 1.1 1.1Russia . . . . . . 0.7 0.7Ukraine . . . . . . 0.2 0.2Japan . . . . . . 1.2 1.2China . . . . . . 10.7 12.5Sheep, goat meatWorld total . . . . . . 11.1 11.5All meatTotal . . . . . . 217.3 227.2See as table: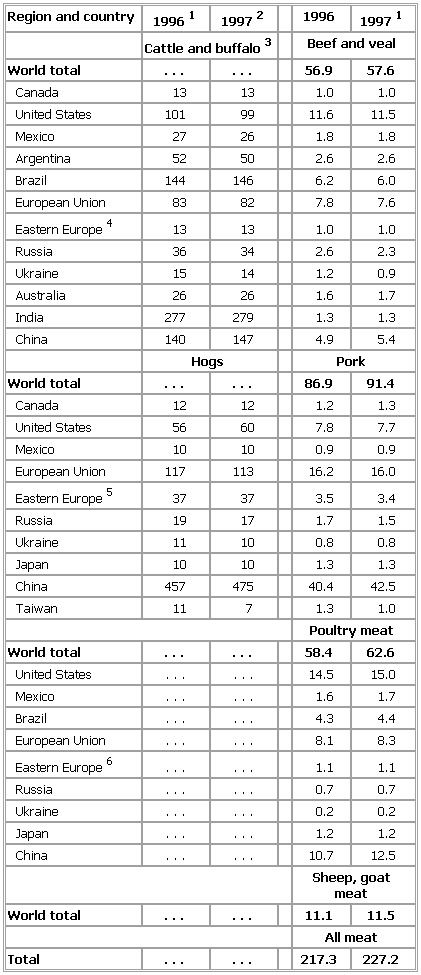 1Preliminary.2Forecast.3Livestock numbers at year's end.4Bulgaria, Czech Republic, Poland, and Romania.5Bulgaria, Czech Republic, Hungary, Poland, and Romania.6Hungary, Poland, and Romania.
* * *
Universalium. 2010.