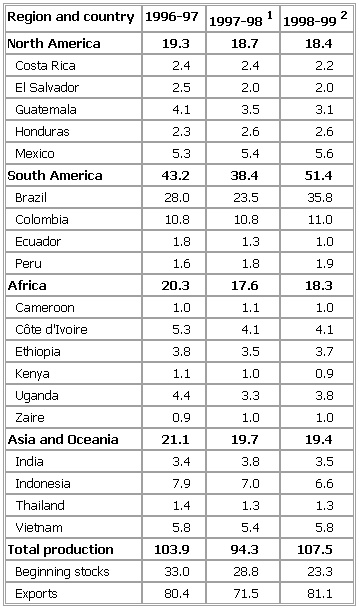
- World Green Coffee Production, Table
-
▪ 1999Table VIII. World Green Coffee ProductionIn 000,000 60-kg bagsRegion and country 1996-97 1997-981 1998-992Costa Rica 2.4 2.4 2.2El Salvador 2.5 2.0 2.0Guatemala 4.1 3.5 3.1Honduras 2.3 2.6 2.6Mexico 5.3 5.4 5.6Brazil 28.0 23.5 35.8Colombia 10.8 10.8 11.0Ecuador 1.8 1.3 1.0Peru 1.6 1.8 1.9Cameroon 1.0 1.1 1.0Côte d'Ivoire 5.3 4.1 4.1Ethiopia 3.8 3.5 3.7Kenya 1.1 1.0 0.9Uganda 4.4 3.3 3.8Zaire 0.9 1.0 1.0Asia and Oceania 21.1 19.7 19.4India 3.4 3.8 3.5Indonesia 7.9 7.0 6.6Thailand 1.4 1.3 1.3Vietnam 5.8 5.4 5.8Total production 103.9 94.3 107.5Beginning stocks 33.0 28.8 23.3Exports 80.4 71.5 81.1See as table:
 1Preliminary.2Forecast.Source: U.S. Department of Agriculture, June 1998.
* * *
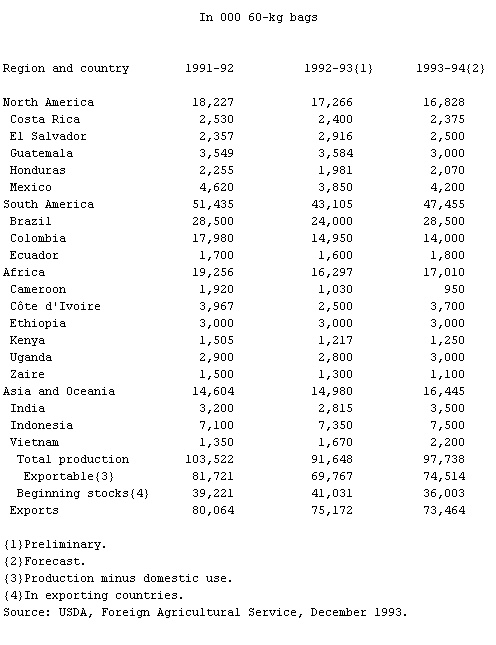
▪ TableIn 000 60-kg bagsRegion and country 1991-92 1992-93{1} 1993-94{2}North America 18,227 17,266 16,828Costa Rica 2,530 2,400 2,375El Salvador 2,357 2,916 2,500Guatemala 3,549 3,584 3,000Honduras 2,255 1,981 2,070Mexico 4,620 3,850 4,200South America 51,435 43,105 47,455Brazil 28,500 24,000 28,500Colombia 17,980 14,950 14,000Ecuador 1,700 1,600 1,800Africa 19,256 16,297 17,010Cameroon 1,920 1,030 950Côte d'Ivoire 3,967 2,500 3,700Ethiopia 3,000 3,000 3,000Kenya 1,505 1,217 1,250Uganda 2,900 2,800 3,000Zaire 1,500 1,300 1,100Asia and Oceania 14,604 14,980 16,445India 3,200 2,815 3,500Indonesia 7,100 7,350 7,500Vietnam 1,350 1,670 2,200Total production 103,522 91,648 97,738Exportable{3} 81,721 69,767 74,514Beginning stocks{4} 39,221 41,031 36,003Exports 80,064 75,172 73,464{1}Preliminary.{2}Forecast.{3}Production minus domestic use.{4}In exporting countries.
* * *
Universalium. 2010.
