- World Green Coffee Production, Table 2
-
▪ TableIn 000 60-kg bagsRegion and country 1993-94 1994-95{1} 1995-96{2}North America 16,679 17,248 18,423
 Costa Rica 2,475 2,492 2,500El Salvador 2,361 2,314 2,425Guatemala 3,078 3,500 3,622Honduras 2,050 2,295 2,400Mexico 4,200 4,030 4,600
 South America 44,577 44,500 35,705 Brazil 28,500 26,000 16,800Colombia 11,400 13,000 13,500Ecuador 2,150 2,400 2,150
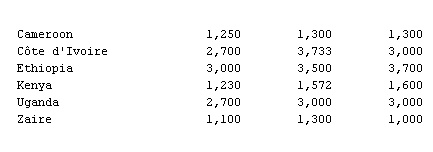
 Africa 15,051 17,877 17,410 Cameroon 1,250 1,300 1,300Côte d'Ivoire 2,700 3,733 3,000Ethiopia 3,000 3,500 3,700Kenya 1,230 1,572 1,600Uganda 2,700 3,000 3,000Zaire 1,100 1,300 1,000
 Asia and Oceania 16,930 16,368 16,688 India 3,465 3,185 3,800Indonesia 7,400 6,000 5,800Vietnam 2,500 3,500 3,500
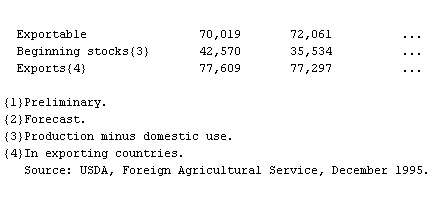
 Total production 93,237 95,993 88,226 Exportable 70,019 72,061 ...Beginning stocks{3} 42,570 35,534 ...Exports{4} 77,609 77,297 ...{1}Preliminary.{2}Forecast.{3}Production minus domestic use.{4}In exporting countries.
* * *
Universalium. 2010.
