World Green Coffee Production, Table 3
- World Green Coffee Production, Table 3
-
Table VIII. World Green Coffee Production
In 000,000 60-kg bags
Region and country 1995-96 1996-971 1997-982
Costa Rica 2.6 2.3 2.4
El Salvador 2.3 2.4 2.6
Guatemala 3.8 4.1 4.2
Honduras 2.3 2.4 2.6
Mexico 5.5 5.6 5.7
Brazil 16.8 27.5 28.0
Colombia 12.9 0.3 11.3
Ecuador 1.9 1.8 1.9
Peru 1.8 1.5 1.8
Cameroon 1.0 1.0 1.0
Côte d'Ivoire 2.9 4.7 3.8
Ethiopia 3.8 4.0 4.0
Kenya 1.6 1.3 1.7
Uganda 4.2 4.0 4.0
Zaire 1.0 0.9 1.0
Asia and Oceania 16.8 19.0 19.2
India 3.7 3.4 3.8
Indonesia 5.8 7.6 6.8
Thailand 1.3 1.3 1.2
Vietnam 3.6 4.2 5.0
Total production 89.2 100.7 103.7
Exportable 65.5 76.3 78.1
Beginning stocks 40.8 32.1 26.0
Exports3 74.7 82.9 84.4
See as table: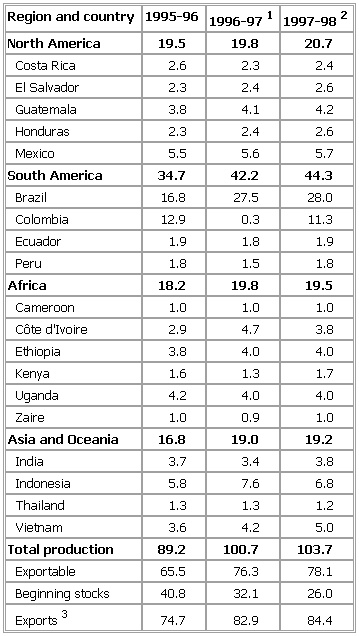
1Preliminary.
2Forecast.
3By exporting countries.
* * *
Universalium.
2010.
Look at other dictionaries:
World Green Coffee Production, Table 1 — ▪ Table Table VIII. World Green Coffee Production In 000,000 60 kg bags Region and country 1994–95 1995–961 1996–972 North America 17.2 18.2 18.5 Costa Rica 2.5 2.6 2.6 El… … Universalium
World Green Coffee Production, Table — ▪ 1999 Table VIII. World Green Coffee Production In 000,000 60 kg bags Region and country 1996 97 1997 981 1998 992 North America 19.3 18.7 18.4 Costa Rica 2.4 2.4 2.2 El Salvador 2.5 2.0 2.0 Guatemala 4.1… … Universalium
World Green Coffee Production, Table 2 — ▪ Table In 000 60 kg bags Region and country 1993 94 1994 95{1} 1995 96{2} North America 16,679 17,248 18,423 Costa Rica 2,475 2,492 2,500 El Salvador 2,361 2,314 2,425 Guatemala 3,078 3,500 3,622 Honduras 2,050 2,295 2,400 Mexico 4,200 4,030… … Universalium
World Green Coffee Production, Table 4 — ▪ Table In 000 60 kg bags Region and country 1992 93 1993 94{1} 1994 95{2} North America 17,874 16,582 16,926 Costa Rica 2,620 2,475 2,300 El Salvador 2,894 2,115 2,520 Guatemala 3,584 3,078 3,027 Honduras 1,981 2,060 2,060 Mexic … Universalium
Coffee — This article is about the beverage. For the bean it is made from, see Coffee bean. For other uses, see Coffee (disambiguation). Coffee A cup of black coffee Type Hot Country of origin … Wikipedia
Coffee processing — Main article: Coffee Traditional coffee drying in Boquete, Panamá Processing of coffee is the method converting the raw fruit of the coffee plant into the coffee. The cherry has the fruit or pulp removed leaving the seed or bean which is then… … Wikipedia
Agriculture and Food Supplies — ▪ 2007 Introduction Bird flu reached Europe and Africa, and concerns over BSE continued to disrupt trade in beef. An international vault for seeds was under construction on an Arctic island. Stocks of important food fish species were reported… … Universalium
Tea production in Sri Lanka — Main articles: Economy of Sri Lanka and Sri Lanka Tea plantation in the Sri Lankan central highlands … Wikipedia
Economics of coffee — Top Ten Green Coffee Producers 2006 (millions of metric tons) Brazil 2.59 Vietnam 0.85 … Wikipedia
History of Oregon wine production — The history of Oregon wine production stretches back to before the state was incorporated. Settlers to the Oregon Territory planted grapes as early as the 1840s, however the production of wine has only been a significant industry in Oregon since… … Wikipedia