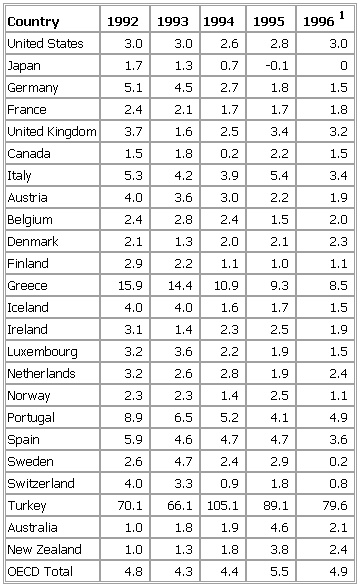
- Consumer Prices in OECD Countries, Table 4
-
▪ TableTable II. Consumer Prices in OECD Countries% change from preceding yearCountry 1992 1993 1994 1995 19961United States 3.0 3.0 2.6 2.8 3.0Japan 1.7 1.3 0.7 -0.1 0Germany 5.1 4.5 2.7 1.8 1.5France 2.4 2.1 1.7 1.7 1.8United Kingdom 3.7 1.6 2.5 3.4 3.2Canada 1.5 1.8 0.2 2.2 1.5Italy 5.3 4.2 3.9 5.4 3.4Austria 4.0 3.6 3.0 2.2 1.9Belgium 2.4 2.8 2.4 1.5 2.0Denmark 2.1 1.3 2.0 2.1 2.3Finland 2.9 2.2 1.1 1.0 1.1Greece 15.9 14.4 10.9 9.3 8.5Iceland 4.0 4.0 1.6 1.7 1.5Ireland 3.1 1.4 2.3 2.5 1.9Luxembourg 3.2 3.6 2.2 1.9 1.5Netherlands 3.2 2.6 2.8 1.9 2.4Norway 2.3 2.3 1.4 2.5 1.1Portugal 8.9 6.5 5.2 4.1 4.9Spain 5.9 4.6 4.7 4.7 3.6Sweden 2.6 4.7 2.4 2.9 0.2Switzerland 4.0 3.3 0.9 1.8 0.8Turkey 70.1 66.1 105.1 89.1 79.6Australia 1.0 1.8 1.9 4.6 2.1New Zealand 1.0 1.3 1.8 3.8 2.4OECD Total 4.8 4.3 4.4 5.5 4.9See as table:
 1Twelve-month rate of change in October 1996.Sources: OECD, The Economist.
* * *
Universalium. 2010.
