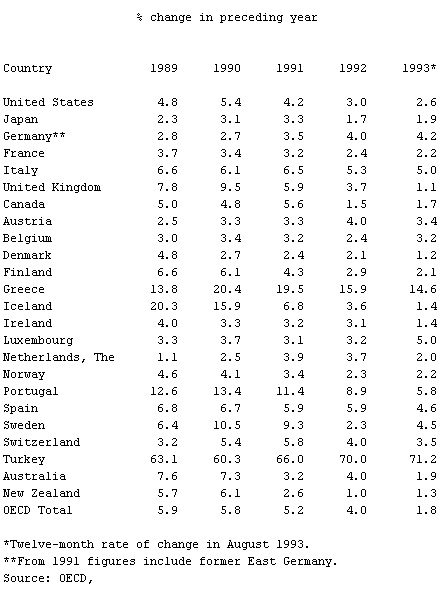
- Consumer Prices in OECD Countries, Table 1
-
▪ Table% change in preceding yearCountry 1989 1990 1991 1992 1993*United States 4.8 5.4 4.2 3.0 2.6Japan 2.3 3.1 3.3 1.7 1.9Germany** 2.8 2.7 3.5 4.0 4.2France 3.7 3.4 3.2 2.4 2.2Italy 6.6 6.1 6.5 5.3 5.0United Kingdom 7.8 9.5 5.9 3.7 1.1Canada 5.0 4.8 5.6 1.5 1.7Austria 2.5 3.3 3.3 4.0 3.4Belgium 3.0 3.4 3.2 2.4 3.2Denmark 4.8 2.7 2.4 2.1 1.2Finland 6.6 6.1 4.3 2.9 2.1Greece 13.8 20.4 19.5 15.9 14.6Iceland 20.3 15.9 6.8 3.6 1.4Ireland 4.0 3.3 3.2 3.1 1.4Luxembourg 3.3 3.7 3.1 3.2 5.0Netherlands, The 1.1 2.5 3.9 3.7 2.0Norway 4.6 4.1 3.4 2.3 2.2Portugal 12.6 13.4 11.4 8.9 5.8Spain 6.8 6.7 5.9 5.9 4.6Sweden 6.4 10.5 9.3 2.3 4.5Switzerland 3.2 5.4 5.8 4.0 3.5Turkey 63.1 60.3 66.0 70.0 71.2Australia 7.6 7.3 3.2 4.0 1.9New Zealand 5.7 6.1 2.6 1.0 1.3OECD Total 5.9 5.8 5.2 4.0 1.8*Twelve-month rate of change in August 1993.**From 1991 figures include former East Germany.Source: OECD,
 Main Economic Indicators.
 * * *
Universalium. 2010.
