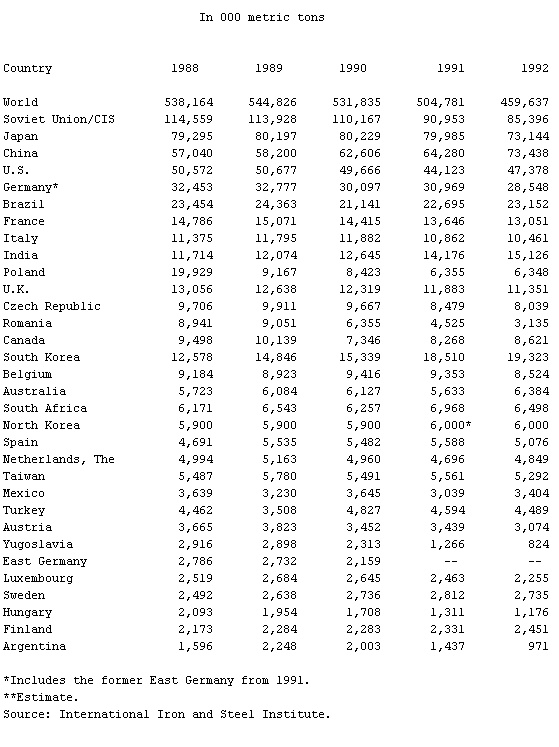
- World Production of Pig Iron, Table
-
▪ TableIn 000 metric tonsCountry 1988 1989 1990 1991 1992World 538,164 544,826 531,835 504,781 459,637Soviet Union/CIS 114,559 113,928 110,167 90,953 85,396Japan 79,295 80,197 80,229 79,985 73,144China 57,040 58,200 62,606 64,280 73,438U.S. 50,572 50,677 49,666 44,123 47,378Germany* 32,453 32,777 30,097 30,969 28,548Brazil 23,454 24,363 21,141 22,695 23,152France 14,786 15,071 14,415 13,646 13,051Italy 11,375 11,795 11,882 10,862 10,461India 11,714 12,074 12,645 14,176 15,126Poland 19,929 9,167 8,423 6,355 6,348U.K. 13,056 12,638 12,319 11,883 11,351Czech Republic 9,706 9,911 9,667 8,479 8,039Romania 8,941 9,051 6,355 4,525 3,135Canada 9,498 10,139 7,346 8,268 8,621South Korea 12,578 14,846 15,339 18,510 19,323Belgium 9,184 8,923 9,416 9,353 8,524Australia 5,723 6,084 6,127 5,633 6,384South Africa 6,171 6,543 6,257 6,968 6,498North Korea 5,900 5,900 5,900 6,000* 6,000Spain 4,691 5,535 5,482 5,588 5,076Netherlands, The 4,994 5,163 4,960 4,696 4,849Taiwan 5,487 5,780 5,491 5,561 5,292Mexico 3,639 3,230 3,645 3,039 3,404Turkey 4,462 3,508 4,827 4,594 4,489Austria 3,665 3,823 3,452 3,439 3,074Yugoslavia 2,916 2,898 2,313 1,266 824East Germany 2,786 2,732 2,159 — —Luxembourg 2,519 2,684 2,645 2,463 2,255Sweden 2,492 2,638 2,736 2,812 2,735Hungary 2,093 1,954 1,708 1,311 1,176Finland 2,173 2,284 2,283 2,331 2,451Argentina 1,596 2,248 2,003 1,437 971*Includes the former East Germany from 1991.**Estimate.Source: International Iron and Steel Institute.

* * *
Universalium. 2010.
