- Standardized Unemployment Rates in Selected Developed Countries, Table
-
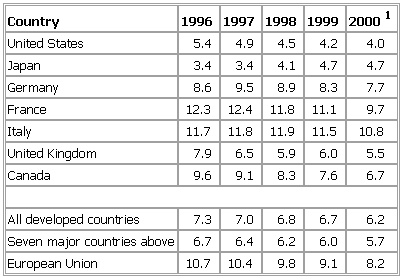
▪ 2001Table II. StandardizedUnemployment Rates inSelected Developed Countries% of total labour forceCountry 1996 1997 1998 1999 20001United States 5.4 4.9 4.5 4.2 4.0Japan 3.4 3.4 4.1 4.7 4.7Germany 8.6 9.5 8.9 8.3 7.7France 12.3 12.4 11.8 11.1 9.7Italy 11.7 11.8 11.9 11.5 10.8United Kingdom 7.9 6.5 5.9 6.0 5.5Canada 9.6 9.1 8.3 7.6 6.7All developed countries 7.3 7.0 6.8 6.7 6.2Seven major countries above 6.7 6.4 6.2 6.0 5.7European Union 10.7 10.4 9.8 9.1 8.2See as table:
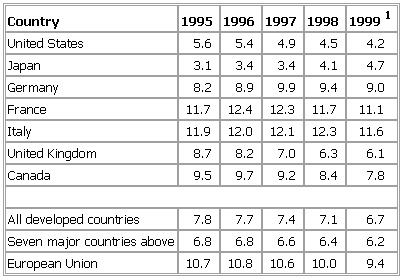
 1Projected.Source: OECD, Economic Outlook, November 2000 (provisional).▪ 2000Table II. Standardized Unemployment Rates in Selected Developed Countries% of total labour forceCountry 1995 1996 1997 1998 19991United States 5.6 5.4 4.9 4.5 4.2Japan 3.1 3.4 3.4 4.1 4.7Germany 8.2 8.9 9.9 9.4 9.0France 11.7 12.4 12.3 11.7 11.1Italy 11.9 12.0 12.1 12.3 11.6United Kingdom 8.7 8.2 7.0 6.3 6.1Canada 9.5 9.7 9.2 8.4 7.8All developed countries 7.8 7.7 7.4 7.1 6.7Seven major countries above 6.8 6.8 6.6 6.4 6.2European Union 10.7 10.8 10.6 10.0 9.4See as table:
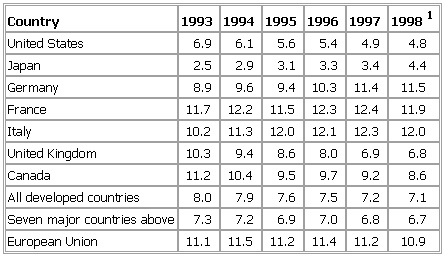
 1Projected.Source: OECD Economic Outlook, December 1999.▪ 1999Table III. Standardized Unemployment Rates in Selected Developed Countries% of total labour forceCountry 1993 1994 1995 1996 1997 19981United States 6.9 6.1 5.6 5.4 4.9 4.8Japan 2.5 2.9 3.1 3.3 3.4 4.4Germany 8.9 9.6 9.4 10.3 11.4 11.5France 11.7 12.2 11.5 12.3 12.4 11.9Italy 10.2 11.3 12.0 12.1 12.3 12.0United Kingdom 10.3 9.4 8.6 8.0 6.9 6.8Canada 11.2 10.4 9.5 9.7 9.2 8.6All developed countries 8.0 7.9 7.6 7.5 7.2 7.1Seven major countries above 7.3 7.2 6.9 7.0 6.8 6.7European Union 11.1 11.5 11.2 11.4 11.2 10.9See as table:
 1Projected.Sources: OECD.
* * *
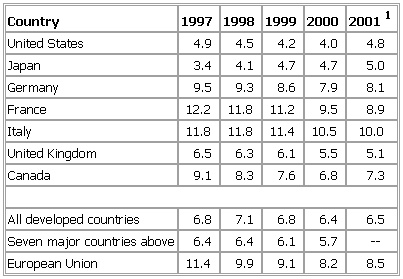
▪ Table% of total labour forceCountry 1997 1998 1999 2000 20011United States 4.9 4.5 4.2 4.0 4.8Japan 3.4 4.1 4.7 4.7 5.0Germany 9.5 9.3 8.6 7.9 8.1France 12.2 11.8 11.2 9.5 8.9Italy 11.8 11.8 11.4 10.5 10.0United Kingdom 6.5 6.3 6.1 5.5 5.1Canada 9.1 8.3 7.6 6.8 7.3All developed countries 6.8 7.1 6.8 6.4 6.5Seven major countries above 6.4 6.4 6.1 5.7 —European Union 11.4 9.9 9.1 8.2 8.5See as table: 1Projected.Source: OECD, Economic Outlook, November 2001.
* * *
Universalium. 2010.
