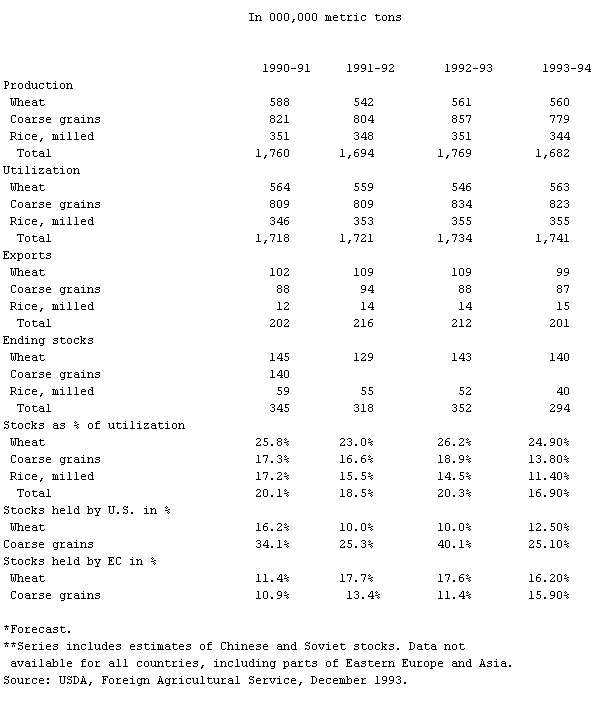
- World Cereal Supply and Distribution, Table 1
-
▪ TableIn 000,000 metric tons1990-91 1991-92 1992-93 1993-94ProductionWheat 588 542 561 560Coarse grains 821 804 857 779Rice, milled 351 348 351 344Total 1,760 1,694 1,769 1,682UtilizationWheat 564 559 546 563Coarse grains 809 809 834 823Rice, milled 346 353 355 355Total 1,718 1,721 1,734 1,741ExportsWheat 102 109 109 99Coarse grains 88 94 88 87Rice, milled 12 14 14 15Total 202 216 212 201Ending stocksWheat 145 129 143 140Coarse grains 140Rice, milled 59 55 52 40Total 345 318 352 294Stocks as % of utilizationWheat 25.8% 23.0% 26.2% 24.90%Coarse grains 17.3% 16.6% 18.9% 13.80%Rice, milled 17.2% 15.5% 14.5% 11.40%Total 20.1% 18.5% 20.3% 16.90%Stocks held by U.S. in %Wheat 16.2% 10.0% 10.0% 12.50%Coarse grains 34.1% 25.3% 40.1% 25.10%Stocks held by EC in %Wheat 11.4% 17.7% 17.6% 16.20%Coarse grains 10.9% 13.4% 11.4% 15.90%*Forecast.**Series includes estimates of Chinese and Soviet stocks. Data notavailable for all countries, including parts of Eastern Europe and Asia.

* * *
Universalium. 2010.
