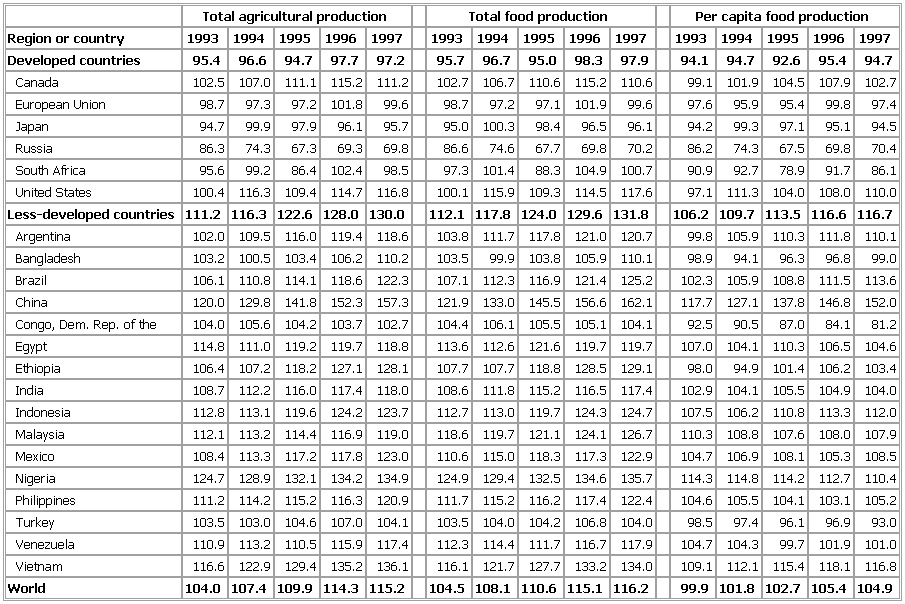
- Selected Indexes of World Agricultural and Food Production, Table 3
-
▪ Table(1989-91 = 100)Total agricultural production Total food production Per capita food productionRegion or country 1993 1994 1995 1996 1997 1993 1994 1995 1996 1997 1993 1994 1995 1996 1997Developed countries 95.4 96.6 94.7 97.7 97.2 95.7 96.7 95.0 98.3 97.9 94.1 94.7 92.6 95.4 94.7Canada 102.5 107.0 111.1 115.2 111.2 102.7 106.7 110.6 115.2 110.6 99.1 101.9 104.5 107.9 102.7European Union 98.7 97.3 97.2 101.8 99.6 98.7 97.2 97.1 101.9 99.6 97.6 95.9 95.4 99.8 97.4Japan 94.7 99.9 97.9 96.1 95.7 95.0 100.3 98.4 96.5 96.1 94.2 99.3 97.1 95.1 94.5Russia 86.3 74.3 67.3 69.3 69.8 86.6 74.6 67.7 69.8 70.2 86.2 74.3 67.5 69.8 70.4South Africa 95.6 99.2 86.4 102.4 98.5 97.3 101.4 88.3 104.9 100.7 90.9 92.7 78.9 91.7 86.1United States 100.4 116.3 109.4 114.7 116.8 100.1 115.9 109.3 114.5 117.6 97.1 111.3 104.0 108.0 110.0Less-developed countries 111.2 116.3 122.6 128.0 130.0 112.1 117.8 124.0 129.6 131.8 106.2 109.7 113.5 116.6 116.7Argentina 102.0 109.5 116.0 119.4 118.6 103.8 111.7 117.8 121.0 120.7 99.8 105.9 110.3 111.8 110.1Bangladesh 103.2 100.5 103.4 106.2 110.2 103.5 99.9 103.8 105.9 110.1 98.9 94.1 96.3 96.8 99.0Brazil 106.1 110.8 114.1 118.6 122.3 107.1 112.3 116.9 121.4 125.2 102.3 105.9 108.8 111.5 113.6China 120.0 129.8 141.8 152.3 157.3 121.9 133.0 145.5 156.6 162.1 117.7 127.1 137.8 146.8 152.0Congo, Dem. Rep. of the 104.0 105.6 104.2 103.7 102.7 104.4 106.1 105.5 105.1 104.1 92.5 90.5 87.0 84.1 81.2Egypt 114.8 111.0 119.2 119.7 118.8 113.6 112.6 121.6 119.7 119.7 107.0 104.1 110.3 106.5 104.6Ethiopia 106.4 107.2 118.2 127.1 128.1 107.7 107.7 118.8 128.5 129.1 98.0 94.9 101.4 106.2 103.4India 108.7 112.2 116.0 117.4 118.0 108.6 111.8 115.2 116.5 117.4 102.9 104.1 105.5 104.9 104.0Indonesia 112.8 113.1 119.6 124.2 123.7 112.7 113.0 119.7 124.3 124.7 107.5 106.2 110.8 113.3 112.0Malaysia 112.1 113.2 114.4 116.9 119.0 118.6 119.7 121.1 124.1 126.7 110.3 108.8 107.6 108.0 107.9Mexico 108.4 113.3 117.2 117.8 123.0 110.6 115.0 118.3 117.3 122.9 104.7 106.9 108.1 105.3 108.5Nigeria 124.7 128.9 132.1 134.2 134.9 124.9 129.4 132.5 134.6 135.7 114.3 114.8 114.2 112.7 110.4Philippines 111.2 114.2 115.2 116.3 120.9 111.7 115.2 116.2 117.4 122.4 104.6 105.5 104.1 103.1 105.2Turkey 103.5 103.0 104.6 107.0 104.1 103.5 104.0 104.2 106.8 104.0 98.5 97.4 96.1 96.9 93.0Venezuela 110.9 113.2 110.5 115.9 117.4 112.3 114.4 111.7 116.7 117.9 104.7 104.3 99.7 101.9 101.0Vietnam 116.6 122.9 129.4 135.2 136.1 116.1 121.7 127.7 133.2 134.0 109.1 112.1 115.4 118.1 116.8See as table:
 Source: World Wide Web site for the Food and Agriculture Organization: http://apps.fao.org (Nov. 5, 1997).
* * *
Universalium. 2010.
