- Indexes of Production, Mining and Mineral Commodities 2
-
▪ Table(1980 = 100)1990 1991 1992 1993 1994Mining (total)
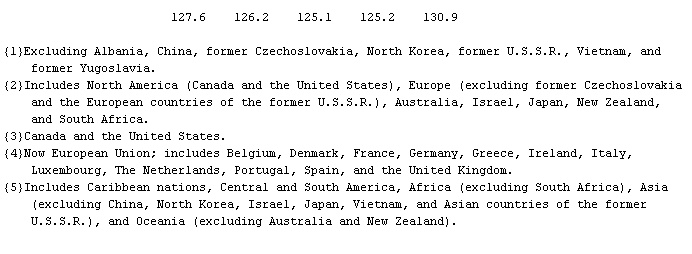
 World{1} 100.2 97.8 101.4 101.3 108.2Developed market economies{2} 106.3 107.3 107.6 108.2 113.4North America{3} 96.2 95.5 94.2 93.0 95.7European Economic Community{4} 90.4 91.9 91.7 92.9 99.9Less developed market economies{5} 96.0 91.3 97.1 96.6 104.6World{1} 100.2 99.0 95.5 91.5 90.5Developed market economies{2} 95.7 93.1 88.1 82.8 81.2North America{3} 129.2 124.7 119.3 117.7 128.1European Economic Community{4} 75.9 72.5 67.1 58.7 50.9Less developed market economies{5} 181.4 203.2 226.2 247.2 256.2
 Petroleum and natural gas World{1} 93.6 90.8 95.8 97.1 105.5Developed market economies{2} 99.0 103.5 106.9 111.9 122.3North America{3} 80.6 81.3 80.6 80.8 82.3European Economic Community{4} 101.3 108.5 114.0 125.3 146.8Less developed market economies{5} 91.4 85.8 91.4 91.2 98.9
 Metals World{1} 136.4 136.9 137.8 135.3 135.2Developed market economies{2} 148.1 147.7 148.1 146.8 144.2North America{3} 139.8 142.0 144.1 140.1 135.6European Economic Community{4} 72.0 69.5 64.9 49.3 47.3Less developed market economies{5} 116.0 118.3 119.9 115.1 119.5{1}Excluding Albania, China, former Czechoslovakia, North Korea, former U.S.S.R., Vietnam, andformer Yugoslavia.{2}Includes North America (Canada and the United States), Europe (excluding former Czechoslovakiaand South Africa.{3}Canada and the United States.{4}Now European Union; includes Belgium, Denmark, France, Germany, Greece, Ireland, Italy,Luxembourg, The Netherlands, Portugal, Spain, and the United Kingdom.{5}Includes Caribbean nations, Central and South America, Africa (excluding South Africa), AsiaU.S.S.R.), and Oceania (excluding Australia and New Zealand).
* * *
Universalium. 2010.


