- Indexes of Production, Mining and Mineral Commodities
-
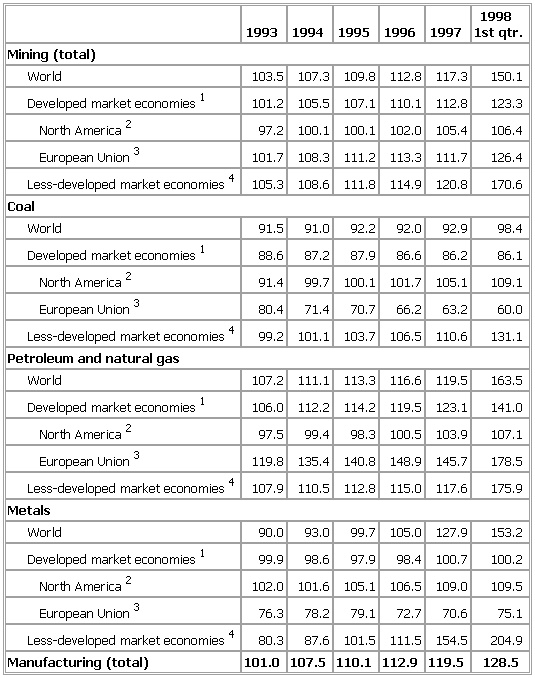
▪ 1999Indexes of Production, Mining and Mineral Commodities(1990 = 100)1993 1994 1995 1996 1997 19981st qtr.World 103.5 107.3 109.8 112.8 117.3 150.1Developed market economies1 101.2 105.5 107.1 110.1 112.8 123.3North America2 97.2 100.1 100.1 102.0 105.4 106.4European Union3 101.7 108.3 111.2 113.3 111.7 126.4Less-developed market economies4 105.3 108.6 111.8 114.9 120.8 170.6World 91.5 91.0 92.2 92.0 92.9 98.4Developed market economies1 88.6 87.2 87.9 86.6 86.2 86.1North America2 91.4 99.7 100.1 101.7 105.1 109.1European Union3 80.4 71.4 70.7 66.2 63.2 60.0Less-developed market economies4 99.2 101.1 103.7 106.5 110.6 131.1Petroleum and natural gasWorld 107.2 111.1 113.3 116.6 119.5 163.5Developed market economies1 106.0 112.2 114.2 119.5 123.1 141.0North America2 97.5 99.4 98.3 100.5 103.9 107.1European Union3 119.8 135.4 140.8 148.9 145.7 178.5Less-developed market economies4 107.9 110.5 112.8 115.0 117.6 175.9MetalsWorld 90.0 93.0 99.7 105.0 127.9 153.2Developed market economies1 99.9 98.6 97.9 98.4 100.7 100.2North America2 102.0 101.6 105.1 106.5 109.0 109.5European Union3 76.3 78.2 79.1 72.7 70.6 75.1Less-developed market economies4 80.3 87.6 101.5 111.5 154.5 204.9Manufacturing (total) 101.0 107.5 110.1 112.9 119.5 128.5See as table:
 Israel, Japan, New Zealand, and South Africa.2Canada and the United States.3Includes Austria, Belgium, Denmark, Finland, France, Germany, Greece, Ireland,Italy, Luxembourg, The Netherlands, Portugal, Spain, Sweden, and the United Kingdom.4Includes Caribbean nations, Central and South America, Africa (excluding SouthZealand).Source: UN, Monthly Bulletin of Statistics, August 1998.
* * *
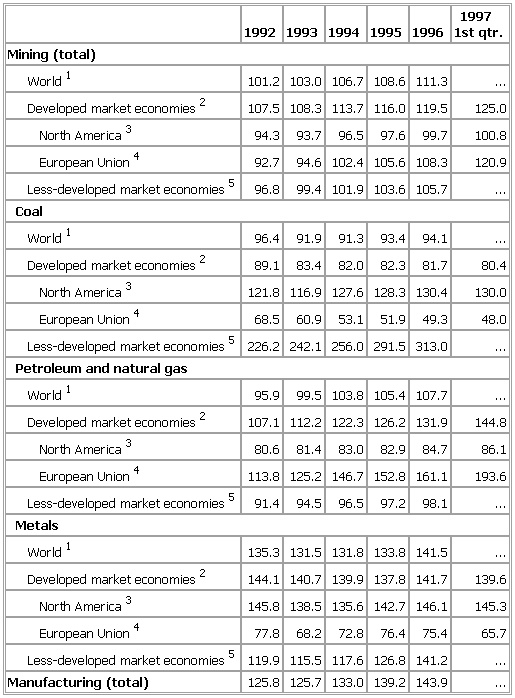
▪ TableIndexes of Production, Mining and Mineral Commodities(1980 = 100)1992 1993 1994 1995 1996 19971st qtr.World1 101.2 103.0 106.7 108.6 111.3 ...Developed market economies2 107.5 108.3 113.7 116.0 119.5 125.0North America3 94.3 93.7 96.5 97.6 99.7 100.8European Union4 92.7 94.6 102.4 105.6 108.3 120.9Less-developed market economies5 96.8 99.4 101.9 103.6 105.7 ...CoalWorld1 96.4 91.9 91.3 93.4 94.1 ...Developed market economies2 89.1 83.4 82.0 82.3 81.7 80.4North America3 121.8 116.9 127.6 128.3 130.4 130.0European Union4 68.5 60.9 53.1 51.9 49.3 48.0Less-developed market economies5 226.2 242.1 256.0 291.5 313.0 ...Petroleum and natural gasWorld1 95.9 99.5 103.8 105.4 107.7 ...Developed market economies2 107.1 112.2 122.3 126.2 131.9 144.8North America3 80.6 81.4 83.0 82.9 84.7 86.1European Union4 113.8 125.2 146.7 152.8 161.1 193.6Less-developed market economies5 91.4 94.5 96.5 97.2 98.1 ...MetalsWorld1 135.3 131.5 131.8 133.8 141.5 ...Developed market economies2 144.1 140.7 139.9 137.8 141.7 139.6North America3 145.8 138.5 135.6 142.7 146.1 145.3European Union4 77.8 68.2 72.8 76.4 75.4 65.7Less-developed market economies5 119.9 115.5 117.6 126.8 141.2 ...Manufacturing (total) 125.8 125.7 133.0 139.2 143.9 ...See as table: 1Excluding Albania, China, former Czechoslovakia, North Korea, former U.S.S.R.,Vietnam, and former Yugoslavia.2Includes North America (Canada and the United States), Europe (excluding formerCzechoslovakia and the European countries of the former U.S.S.R.), Australia,Israel, Japan, New Zealand, and South Africa.3Canada and the United States.4Includes Austria, Belgium, Denmark, France, Germany, Greece, Ireland, Italy,Luxembourg, The Netherlands, Portugal, Spain, Sweden, and the United Kingdom.5Includes Caribbean nations, Central and South America, Africa (excluding Southcountries of the former U.S.S.R.), and Oceania (excluding Australia and NewZealand).Source: UN, Monthly Bulletin of Statistics, August 1997.
* * *
Universalium. 2010.
