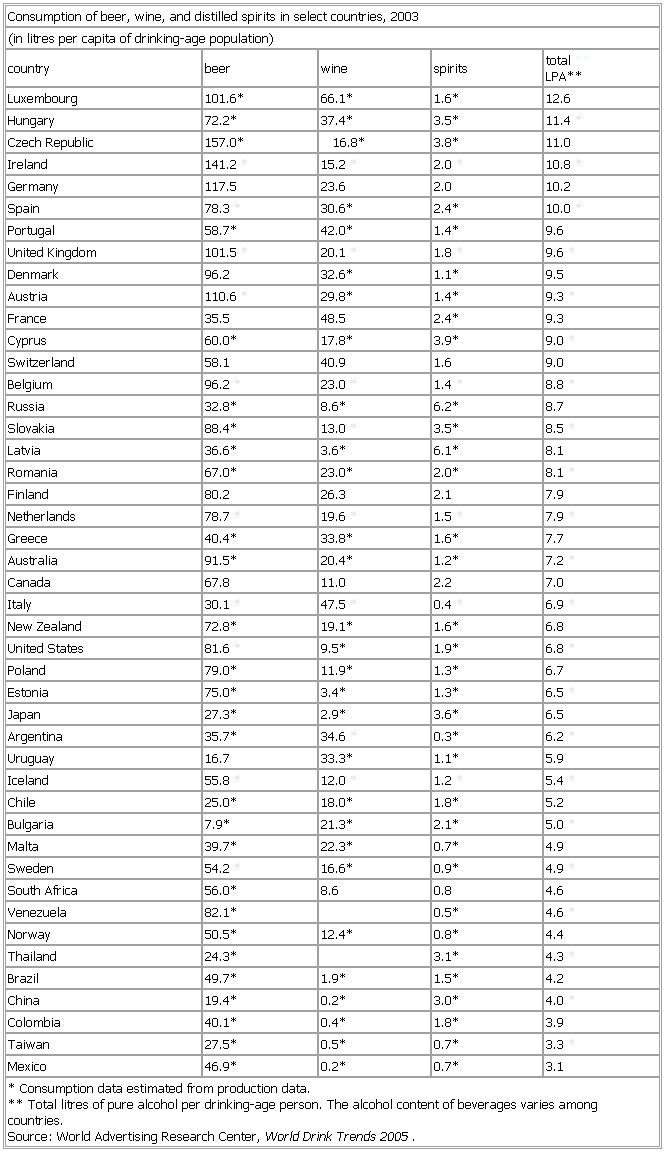
- Consumption of beer, wine, and distilled spirits in select countries, 2003
-
▪ TableConsumption of beer, wine, and distilled spirits in select countries, 2003(in litres per capita of drinking-age population)country beer wine spirits total**LPA**Luxembourg 101.6* 66.1* 1.6* 12.6*Hungary 72.2* 37.4* 3.5* 11.4*Czech Republic 157.0* *16.8* 3.8* 11.0*Ireland 141.2* 15.2* 2.0* 10.8*Germany 117.5* 23.6* 2.0* 10.2*Spain 78.3* 30.6* 2.4* 10.0*Portugal 58.7* 42.0* 1.4* 9.6*United Kingdom 101.5* 20.1* 1.8* 9.6*Denmark 96.2* 32.6* 1.1* 9.5*Austria 110.6* 29.8* 1.4* 9.3*France 35.5* 48.5* 2.4* 9.3*Cyprus 60.0* 17.8* 3.9* 9.0*Switzerland 58.1* 40.9* 1.6* 9.0*Belgium 96.2* 23.0* 1.4* 8.8*Russia 32.8* 8.6* 6.2* 8.7*Slovakia 88.4* 13.0* 3.5* 8.5*Latvia 36.6* 3.6* 6.1* 8.1*Romania 67.0* 23.0* 2.0* 8.1*Finland 80.2* 26.3* 2.1* 7.9*Netherlands 78.7* 19.6* 1.5* 7.9*Greece 40.4* 33.8* 1.6* 7.7*Australia 91.5* 20.4* 1.2* 7.2*Canada 67.8* 11.0* 2.2* 7.0*Italy 30.1* 47.5* 0.4* 6.9*New Zealand 72.8* 19.1* 1.6* 6.8*United States 81.6* 9.5* 1.9* 6.8*Poland 79.0* 11.9* 1.3* 6.7*Estonia 75.0* 3.4* 1.3* 6.5*Japan 27.3* 2.9* 3.6* 6.5*Argentina 35.7* 34.6* 0.3* 6.2*Uruguay 16.7* 33.3* 1.1* 5.9*Iceland 55.8* 12.0* 1.2* 5.4*Chile 25.0* 18.0* 1.8* 5.2*Bulgaria 7.9* 21.3* 2.1* 5.0*Malta 39.7* 22.3* 0.7* 4.9*Sweden 54.2* 16.6* 0.9* 4.9*South Africa 56.0* 8.6* 0.8* 4.6*Venezuela 82.1* 0.5* 4.6*Norway 50.5* 12.4* 0.8* 4.4*Thailand 24.3* 3.1* 4.3*Brazil 49.7* 1.9* 1.5* 4.2*China 19.4* 0.2* 3.0* 4.0*Colombia 40.1* 0.4* 1.8* 3.9*Taiwan 27.5* 0.5* 0.7* 3.3*Mexico 46.9* 0.2* 0.7* 3.1** Consumption data estimated from production data.** Total litres of pure alcohol per drinking-age person. The alcohol content of beverages varies among countries.Source: World Advertising Research Center, World Drink Trends 2005.See as table:

* * *
Universalium. 2010.
