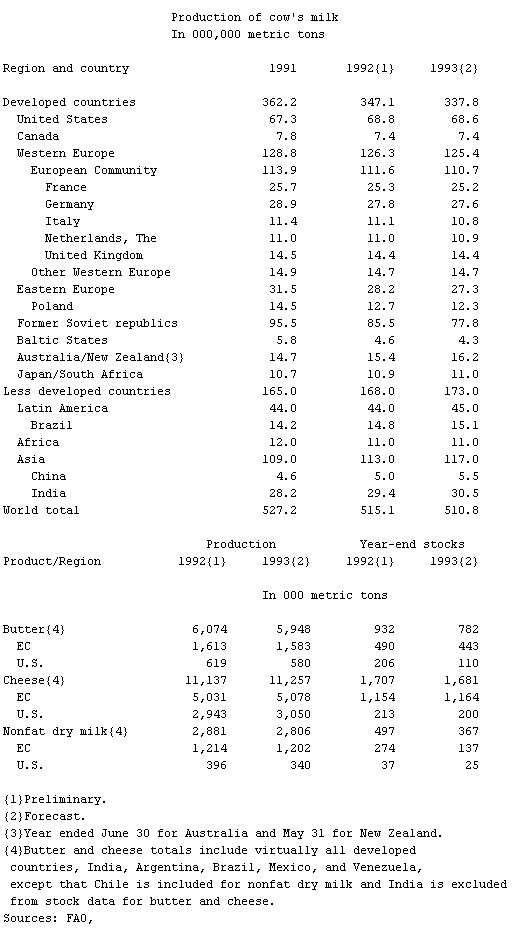
- World Production of Dairy Products, Table
-
▪ TableProduction of cow's milkIn 000,000 metric tonsRegion and country 1991 1992{1} 1993{2}Developed countries 362.2 347.1 337.8United States 67.3 68.8 68.6Canada 7.8 7.4 7.4Western Europe 128.8 126.3 125.4European Community 113.9 111.6 110.7France 25.7 25.3 25.2Germany 28.9 27.8 27.6Italy 11.4 11.1 10.8Netherlands, The 11.0 11.0 10.9United Kingdom 14.5 14.4 14.4Other Western Europe 14.9 14.7 14.7Eastern Europe 31.5 28.2 27.3Poland 14.5 12.7 12.3Former Soviet republics 95.5 85.5 77.8Baltic States 5.8 4.6 4.3Australia/New Zealand{3} 14.7 15.4 16.2Japan/South Africa 10.7 10.9 11.0Less developed countries 165.0 168.0 173.0Latin America 44.0 44.0 45.0Brazil 14.2 14.8 15.1Africa 12.0 11.0 11.0Asia 109.0 113.0 117.0China 4.6 5.0 5.5India 28.2 29.4 30.5World total 527.2 515.1 510.8Production Year-end stocksProduct/Region 1992{1} 1993{2} 1992{1} 1993{2}In 000 metric tonsButter{4} 6,074 5,948 932 782EC 1,613 1,583 490 443U.S. 619 580 206 110Cheese{4} 11,137 11,257 1,707 1,681EC 5,031 5,078 1,154 1,164U.S. 2,943 3,050 213 200Nonfat dry milk{4} 2,881 2,806 497 367EC 1,214 1,202 274 137U.S. 396 340 37 25{1}Preliminary.{2}Forecast.{3}Year ended June 30 for Australia and May 31 for New Zealand.{4}Butter and cheese totals include virtually all developedcountries, India, Argentina, Brazil, Mexico, and Venezuela,except that Chile is included for nonfat dry milk and India is excludedfrom stock data for butter and cheese.USDA, Foreign Agricultural Service, July 1993.
* * *
Universalium. 2010.

