- World Production of Milk, Table
-
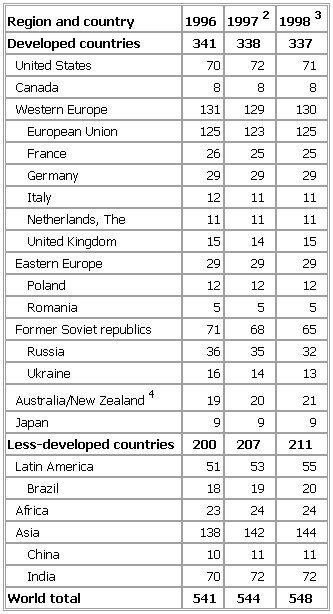
▪ 1999Table VI. World Production of Milk1In 000,000 metric tonsRegion and country 1996 19972 19983Developed countries 341 338 337United States 70 72 71Canada 8 8 8Western Europe 131 129 130European Union 125 123 125France 26 25 25Germany 29 29 29Italy 12 11 11Netherlands, The 11 11 11United Kingdom 15 14 15Eastern Europe 29 29 29Poland 12 12 12Romania 5 5 5Former Soviet republics 71 68 65Russia 36 35 32Ukraine 16 14 13Australia/New Zealand4 19 20 21Japan 9 9 9Less-developed countries 200 207 211Latin America 51 53 55Brazil 18 19 20Africa 23 24 24Asia 138 142 144China 10 11 11India 70 72 72World total 541 544 548See as table:
 1Includes milk from cattle, buffalo, camels, sheep,and goats.2Preliminary.3Forecast.4Year ended June 30 of year shown for Australiaand May 31 for New Zealand.Source: UN Food and Agriculture Organization,December 1998.
* * *
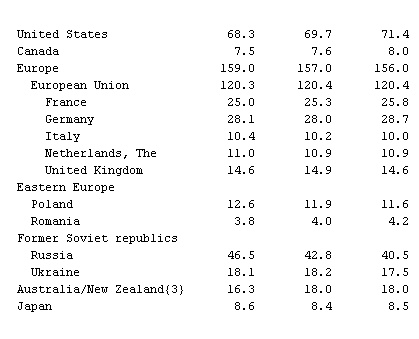
▪ TableIn 000,000 metric tonsRegion and country 1993 1994{1} 1995{2}Developed countries 350.0 345.0 342.0 United States 68.3 69.7 71.4Canada 7.5 7.6 8.0Europe 159.0 157.0 156.0European Union 120.3 120.4 120.4France 25.0 25.3 25.8Germany 28.1 28.0 28.7Italy 10.4 10.2 10.0Netherlands, The 11.0 10.9 10.9United Kingdom 14.6 14.9 14.6Eastern EuropePoland 12.6 11.9 11.6Romania 3.8 4.0 4.2Former Soviet republicsRussia 46.5 42.8 40.5Ukraine 18.1 18.2 17.5Australia/New Zealand{3} 16.3 18.0 18.0Japan 8.6 8.4 8.5
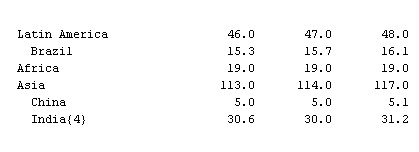
 Less developed countries 178.0 180.0 184.0 Latin America 46.0 47.0 48.0Brazil 15.3 15.7 16.1Africa 19.0 19.0 19.0Asia 113.0 114.0 117.0China 5.0 5.0 5.1India{4} 30.6 30.0 31.2
 World total 528.0 525.0 526.0 {1}Preliminary.{2}Forecast.{3}Year ended June 30 for Australia and May 31 for New Zealand.{4}Year begun April 1.Sources: FAO,
 Food Outlook, May-June 1995; USDA, Foreign Agricultural Service, September 1995.
* * *
Universalium. 2010.
