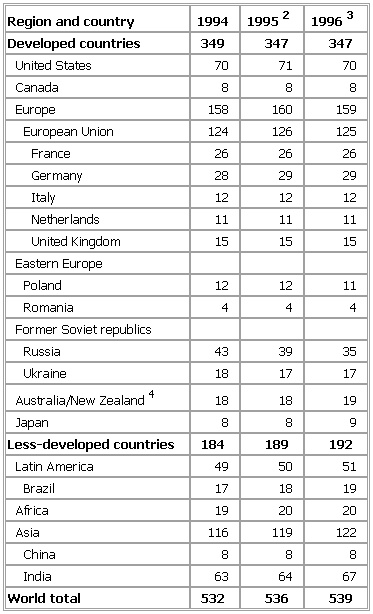
World Production of Milk1, Table
- World Production of Milk1, Table
-
Table VI. World Production of Milk1
In 000,000 metric tons
Region and country 1994 19952 19963
Developed countries 349 347 347
United States 70 71 70
Canada 8 8 8
Europe 158 160 159
European Union 124 126 125
France 26 26 26
Germany 28 29 29
Italy 12 12 12
Netherlands 11 11 11
United Kingdom 15 15 15
Eastern Europe
Poland 12 12 11
Romania 4 4 4
Former Soviet republics
Russia 43 39 35
Ukraine 18 17 17
Australia/New Zealand4 18 18 19
Japan 8 8 9
Less-developed countries 184 189 192
Latin America 49 50 51
Brazil 17 18 19
Africa 19 20 20
Asia 116 119 122
China 8 8 8
India 63 64 67
World total 532 536 539
See as table:
1Includes milk from cattle, buffalo, camels, sheep,
and goats. 2Preliminary. 3Forecast. 4Year ended
June 30 for Australia and May 31 for New Zealand.
* * *
Universalium.
2010.
Look at other dictionaries:
World Production of Milk, Table 1 — ▪ Table Table VI. World Production of Milk1 In 000,000 metric tons Region and country 1995 19962 19973 Developed countries 342 336 338 United States 70 70 71 Canada 8 8 8 Europe 160 159 160 European Union 125 125 124 France… … Universalium
World Production of Milk, Table — ▪ 1999 Table VI. World Production of Milk1 In 000,000 metric tons Region and country 1996 19972 19983 Developed countries 341 338 337 United States 70 72 71 Canada 8 8 8 Western Europe 131 129 130 European Union 125… … Universalium
Agriculture and Food Supplies — ▪ 2007 Introduction Bird flu reached Europe and Africa, and concerns over BSE continued to disrupt trade in beef. An international vault for seeds was under construction on an Arctic island. Stocks of important food fish species were reported… … Universalium
 1Includes milk from cattle, buffalo, camels, sheep,and goats. 2Preliminary. 3Forecast. 4Year endedJune 30 for Australia and May 31 for New Zealand.