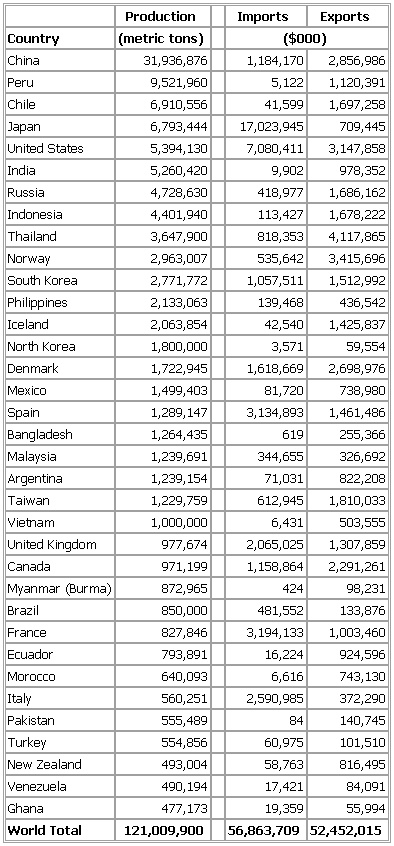
- Fishery Production and Trade by Principal Producers in 1996
-
▪ 1999Production Imports ExportsCountry (metric tons) ($000)China 31,936,876 1,184,170 2,856,986Peru 9,521,960 5,122 1,120,391Chile 6,910,556 41,599 1,697,258Japan 6,793,444 17,023,945 709,445United States 5,394,130 7,080,411 3,147,858India 5,260,420 9,902 978,352Russia 4,728,630 418,977 1,686,162Indonesia 4,401,940 113,427 1,678,222Thailand 3,647,900 818,353 4,117,865Norway 2,963,007 535,642 3,415,696South Korea 2,771,772 1,057,511 1,512,992Philippines 2,133,063 139,468 436,542Iceland 2,063,854 42,540 1,425,837North Korea 1,800,000 3,571 59,554Denmark 1,722,945 1,618,669 2,698,976Mexico 1,499,403 81,720 738,980Spain 1,289,147 3,134,893 1,461,486Bangladesh 1,264,435 619 255,366Malaysia 1,239,691 344,655 326,692Argentina 1,239,154 71,031 822,208Taiwan 1,229,759 612,945 1,810,033Vietnam 1,000,000 6,431 503,555United Kingdom 977,674 2,065,025 1,307,859Canada 971,199 1,158,864 2,291,261Myanmar (Burma) 872,965 424 98,231Brazil 850,000 481,552 133,876France 827,846 3,194,133 1,003,460Ecuador 793,891 16,224 924,596Morocco 640,093 6,616 743,130Italy 560,251 2,590,985 372,290Pakistan 555,489 84 140,745Turkey 554,856 60,975 101,510New Zealand 493,004 58,763 816,495Venezuela 490,194 17,421 84,091Ghana 477,173 19,359 55,994World Total 121,009,900 56,863,709 52,452,015See as table:
 Source: UN Food and Agriculture Organization, Yearbook ofFishery Statistics, vol. 82 and 83.
* * *
Universalium. 2010.
