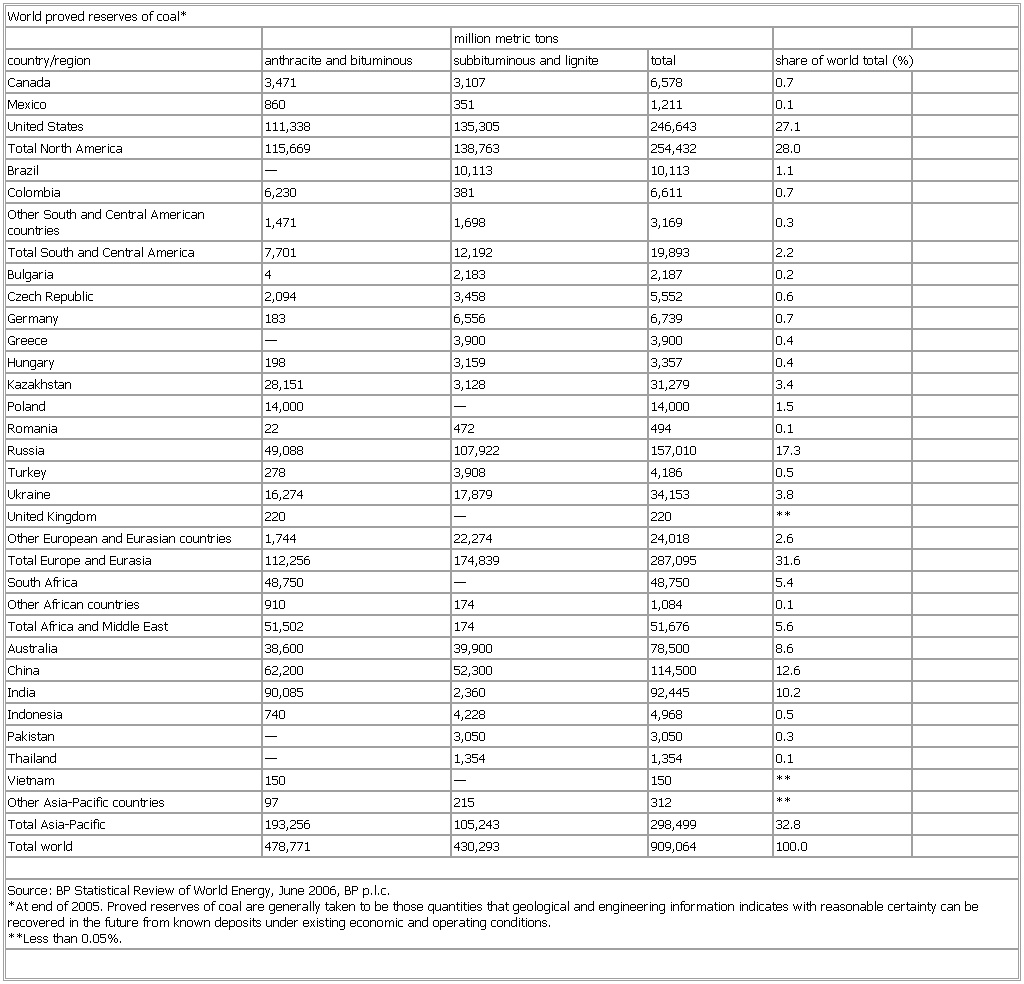
- World proved reserves of coal
-
▪ TableWorld proved reserves of coal*million metric tonscountry/region anthracite and bituminous subbituminous and lignite total share of world total (%)Canada 3,471 3,107 6,578 0.7Mexico 860 351 1,211 0.1United States 111,338 135,305 246,643 27.1Total North America 115,669 138,763 254,432 28.0Brazil — 10,113 10,113 1.1Colombia 6,230 381 6,611 0.7Other South and Central American countries 1,471 1,698 3,169 0.3Total South and Central America 7,701 12,192 19,893 2.2Bulgaria 4 2,183 2,187 0.2Czech Republic 2,094 3,458 5,552 0.6Germany 183 6,556 6,739 0.7Greece — 3,900 3,900 0.4Hungary 198 3,159 3,357 0.4Kazakhstan 28,151 3,128 31,279 3.4Poland 14,000 — 14,000 1.5Romania 22 472 494 0.1Russia 49,088 107,922 157,010 17.3Turkey 278 3,908 4,186 0.5Ukraine 16,274 17,879 34,153 3.8United Kingdom 220 — 220 **Other European and Eurasian countries 1,744 22,274 24,018 2.6Total Europe and Eurasia 112,256 174,839 287,095 31.6South Africa 48,750 — 48,750 5.4Other African countries 910 174 1,084 0.1Total Africa and Middle East 51,502 174 51,676 5.6Australia 38,600 39,900 78,500 8.6China 62,200 52,300 114,500 12.6India 90,085 2,360 92,445 10.2Indonesia 740 4,228 4,968 0.5Pakistan — 3,050 3,050 0.3Thailand — 1,354 1,354 0.1Vietnam 150 — 150 **Other Asia-Pacific countries 97 215 312 **Total Asia-Pacific 193,256 105,243 298,499 32.8Total world 478,771 430,293 909,064 100.0Source: BP Statistical Review of World Energy, June 2006, BP p.l.c.*At end of 2005. Proved reserves of coal are generally taken to be those quantities that geological and engineering information indicates with reasonable certainty can be recovered in the future from known deposits under existing economic and operating conditions.**Less than 0.05%.See as table:

* * *
Universalium. 2010.
