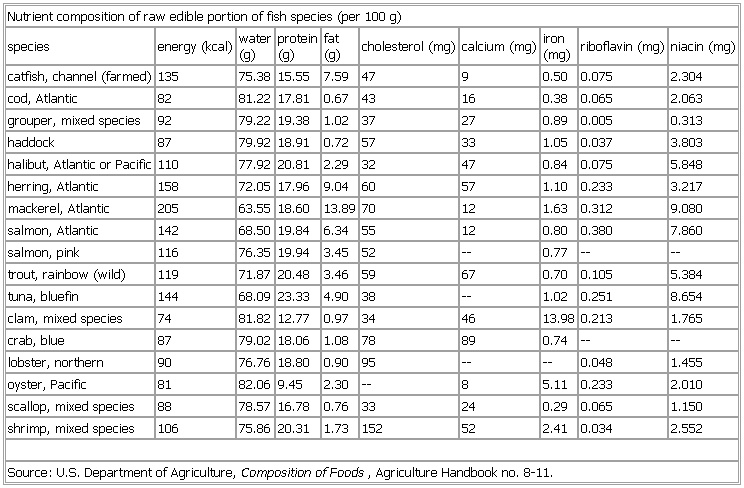
- Nutrient Composition of raw edible portion of fish species
-
▪ TableNutrient composition of raw edible portion of fish species (per 100 g)(g) protein(g) fatcatfish, channel (farmed) 135 75.38 15.55 7.59 47 9 0.50 0.075 2.304cod, Atlantic 82 81.22 17.81 0.67 43 16 0.38 0.065 2.063grouper, mixed species 92 79.22 19.38 1.02 37 27 0.89 0.005 0.313haddock 87 79.92 18.91 0.72 57 33 1.05 0.037 3.803halibut, Atlantic or Pacific 110 77.92 20.81 2.29 32 47 0.84 0.075 5.848herring, Atlantic 158 72.05 17.96 9.04 60 57 1.10 0.233 3.217mackerel, Atlantic 205 63.55 18.60 13.89 70 12 1.63 0.312 9.080salmon, Atlantic 142 68.50 19.84 6.34 55 12 0.80 0.380 7.860salmon, pink 116 76.35 19.94 3.45 52 — 0.77 — —tuna, bluefin 144 68.09 23.33 4.90 38 — 1.02 0.251 8.654clam, mixed species 74 81.82 12.77 0.97 34 46 13.98 0.213 1.765crab, blue 87 79.02 18.06 1.08 78 89 0.74 — —lobster, northern 90 76.76 18.80 0.90 95 — — 0.048 1.455oyster, Pacific 81 82.06 9.45 2.30 — 8 5.11 0.233 2.010scallop, mixed species 88 78.57 16.78 0.76 33 24 0.29 0.065 1.150shrimp, mixed species 106 75.86 20.31 1.73 152 52 2.41 0.034 2.552Source: U.S. Department of Agriculture, Composition of Foods, Agriculture Handbook no. 8-11.See as table:

* * *
Universalium. 2010.
