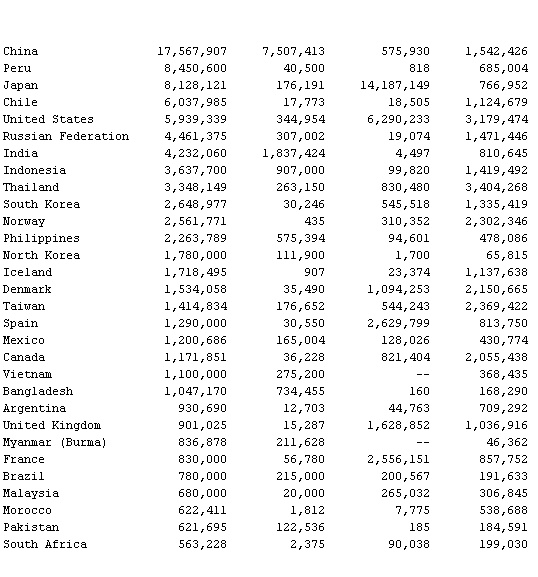
- World Fisheries, 1993, Table
-
▪ TableCatch Tradein 000 metric tons in $000Country Total Inland Imports Exports
 China 17,567,907 7,507,413 575,930 1,542,426Peru 8,450,600 40,500 818 685,004Japan 8,128,121 176,191 14,187,149 766,952Chile 6,037,985 17,773 18,505 1,124,679United States 5,939,339 344,954 6,290,233 3,179,474Russian Federation 4,461,375 307,002 19,074 1,471,446India 4,232,060 1,837,424 4,497 810,645Indonesia 3,637,700 907,000 99,820 1,419,492Thailand 3,348,149 263,150 830,480 3,404,268South Korea 2,648,977 30,246 545,518 1,335,419Norway 2,561,771 435 310,352 2,302,346Philippines 2,263,789 575,394 94,601 478,086North Korea 1,780,000 111,900 1,700 65,815Iceland 1,718,495 907 23,374 1,137,638Denmark 1,534,058 35,490 1,094,253 2,150,665Taiwan 1,414,834 176,652 544,243 2,369,422Spain 1,290,000 30,550 2,629,799 813,750Mexico 1,200,686 165,004 128,026 430,774Canada 1,171,851 36,228 821,404 2,055,438Vietnam 1,100,000 275,200 — 368,435Bangladesh 1,047,170 734,455 160 168,290Argentina 930,690 12,703 44,763 709,292United Kingdom 901,025 15,287 1,628,852 1,036,916Myanmar (Burma) 836,878 211,628 — 46,362France 830,000 56,780 2,556,151 857,752Brazil 780,000 215,000 200,567 191,633Malaysia 680,000 20,000 265,032 306,845Morocco 622,411 1,812 7,775 538,688Pakistan 621,695 122,536 185 184,591South Africa 563,228 2,375 90,038 199,030
 World Total 101,417,500 17,168,500 44,621,848 41,193,392 {1}Excludes aquatic mammals, crocodiles and alligators, pearls,corals, sponges, and aquatic plants.Source: United Nations Food and Agriculture Organization,
 Yearbook of Fishery Statistics, vol. 76 and 77.
 * * *
Universalium. 2010.
