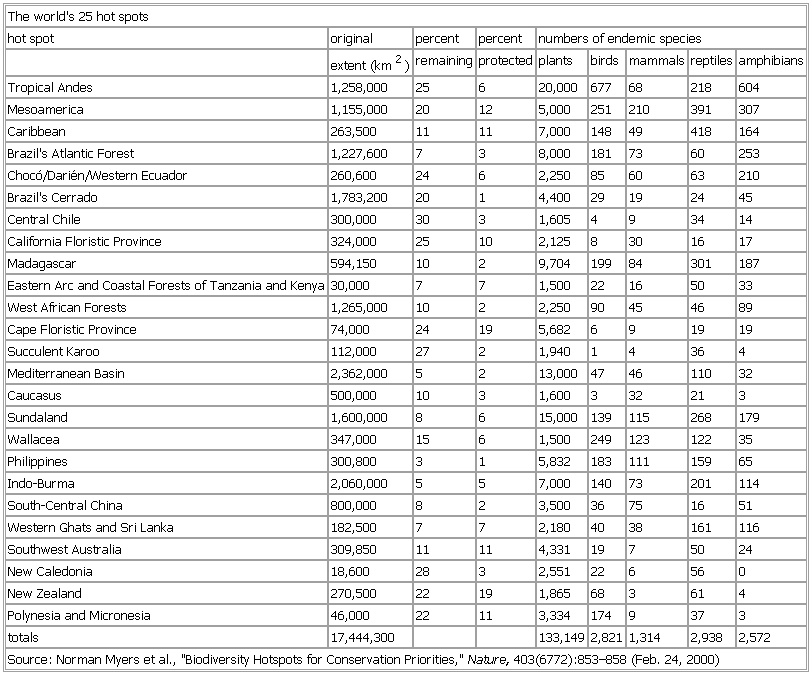
- world's 25 hot spots
-
▪ TableThe world's 25 hot spotshot spot original percent percent numbers of endemic speciesextent (km2) remaining protected plants birds mammals reptiles amphibiansTropical Andes 1,258,000 25 6 20,000 677 68 218 604Mesoamerica 1,155,000 20 12 5,000 251 210 391 307Caribbean 263,500 11 11 7,000 148 49 418 164Brazil's Atlantic Forest 1,227,600 7 3 8,000 181 73 60 253Chocó/Darién/Western Ecuador 260,600 24 6 2,250 85 60 63 210Brazil's Cerrado 1,783,200 20 1 4,400 29 19 24 45Central Chile 300,000 30 3 1,605 4 9 34 14California Floristic Province 324,000 25 10 2,125 8 30 16 17Madagascar 594,150 10 2 9,704 199 84 301 187Eastern Arc and Coastal Forests of Tanzania and Kenya 30,000 7 7 1,500 22 16 50 33West African Forests 1,265,000 10 2 2,250 90 45 46 89Cape Floristic Province 74,000 24 19 5,682 6 9 19 19Succulent Karoo 112,000 27 2 1,940 1 4 36 4Mediterranean Basin 2,362,000 5 2 13,000 47 46 110 32Caucasus 500,000 10 3 1,600 3 32 21 3Sundaland 1,600,000 8 6 15,000 139 115 268 179Wallacea 347,000 15 6 1,500 249 123 122 35Philippines 300,800 3 1 5,832 183 111 159 65Indo-Burma 2,060,000 5 5 7,000 140 73 201 114South-Central China 800,000 8 2 3,500 36 75 16 51Western Ghats and Sri Lanka 182,500 7 7 2,180 40 38 161 116Southwest Australia 309,850 11 11 4,331 19 7 50 24New Caledonia 18,600 28 3 2,551 22 6 56 0New Zealand 270,500 22 19 1,865 68 3 61 4Polynesia and Micronesia 46,000 22 11 3,334 174 9 37 3totals 17,444,300 133,149 2,821 1,314 2,938 2,572Source: Norman Myers et al., "Biodiversity Hotspots for Conservation Priorities," Nature, 403(6772):853–858 (Feb. 24, 2000)See as table:

* * *
Universalium. 2010.
