- World Production of Centrifugal Sugar, Table
-
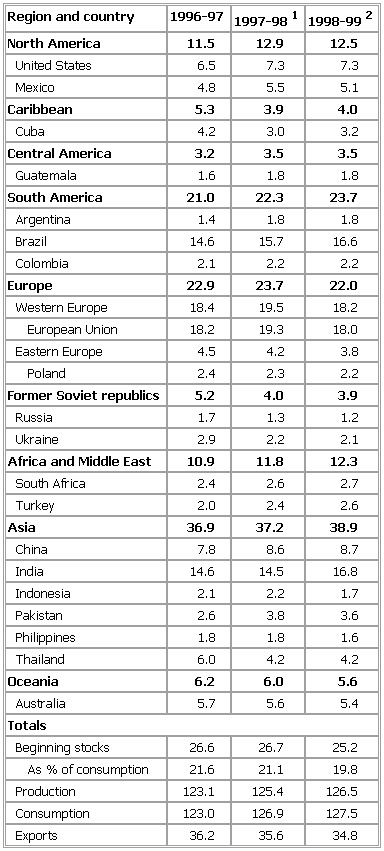
▪ 1999Table VII. World Production of Centrifugal (Freed from Liquid) SugarIn 000,000 metric tonsRegion and country 1996-97 1997-981 1998-992North America 11.5 12.9 12.5United States 6.5 7.3 7.3Mexico 4.8 5.5 5.1Caribbean 5.3 3.9 4.0Cuba 4.2 3.0 3.2Central America 3.2 3.5 3.5Guatemala 1.6 1.8 1.8South America 21.0 22.3 23.7Argentina 1.4 1.8 1.8Brazil 14.6 15.7 16.6Colombia 2.1 2.2 2.2Europe 22.9 23.7 22.0Western Europe 18.4 19.5 18.2European Union 18.2 19.3 18.0Eastern Europe 4.5 4.2 3.8Poland 2.4 2.3 2.2Former Soviet republics 5.2 4.0 3.9Russia 1.7 1.3 1.2Ukraine 2.9 2.2 2.1Africa and Middle East 10.9 11.8 12.3South Africa 2.4 2.6 2.7Turkey 2.0 2.4 2.6Asia 36.9 37.2 38.9China 7.8 8.6 8.7India 14.6 14.5 16.8Indonesia 2.1 2.2 1.7Pakistan 2.6 3.8 3.6Philippines 1.8 1.8 1.6Thailand 6.0 4.2 4.2Oceania 6.2 6.0 5.6Australia 5.7 5.6 5.4TotalsBeginning stocks 26.6 26.7 25.2As % of consumption 21.6 21.1 19.8Production 123.1 125.4 126.5Consumption 123.0 126.9 127.5Exports 36.2 35.6 34.8See as table:
 1Preliminary.2Forecast.Source: U.S. Department of Agriculture, December 1998.
* * *
▪ TableIn 000,000 metric tons raw valueRegion and country 1992-93 1993-94 1994-95{1}North America 11.6 10.9 11.6United States 7.1 7.0 7.4Mexico 4.3 3.8 4.0 Caribbean 5.4 5.1 4.3 Cuba 4.3 4.0 3.2Central America 2.3 2.5 2.5Guatemala 1.1 1.2 1.2South America 15.5 15.4 16.2Argentina 1.4 1.1 1.2Brazil 9.8 9.9 10.5Colombia 1.8 1.8 2.0
 Europe 21.6 22.3 19.9 Western Europe 18.1 18.6 16.5European Union 17.1 17.4 15.4France 4.7 4.8 4.3Germany 4.4 4.8 4.0Eastern Europe 3.4 3.6 3.4Poland 1.6 2.3 1.7
 Former Soviet republics{2} 7.1 7.5 6.3 Russian Federation 2.5 2.7 2.0Ukraine 4.0 4.2 3.8
 Africa and Middle East 10.0 9.8 10.8 South Africa 1.6 1.7 2.1Turkey 2.1 2.2 2.1
 Asia 33.7 31.9 35.4 China 8.3 6.5 6.2India 12.5 11.7 14.4Indonesia 2.3 2.5 2.5Pakistan 2.6 3.1 3.3Philippines 2.1 1.8 2.0Thailand 3.8 4.0 4.7
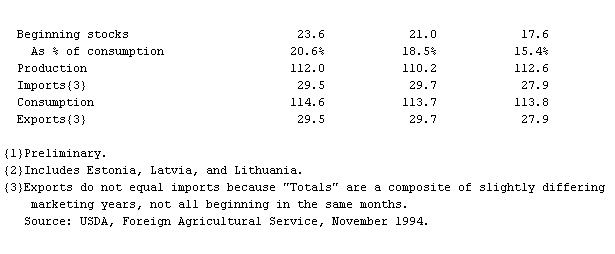
 Oceania 4.8 5.0 5.5 Australia 4.4 4.5 5.0TotalsBeginning stocks 23.6 21.0 17.6As % of consumption 20.6% 18.5% 15.4%Production 112.0 110.2 112.6Imports{3} 29.5 29.7 27.9Consumption 114.6 113.7 113.8Exports{3} 29.5 29.7 27.9{1}Preliminary.{2}Includes Estonia, Latvia, and Lithuania.{3}Exports do not equal imports because "Totals" are a composite of slightly differingmarketing years, not all beginning in the same months.
* * *
Universalium. 2010.
