- phosphate rock
-
phosphorite.[1865-70]
* * *
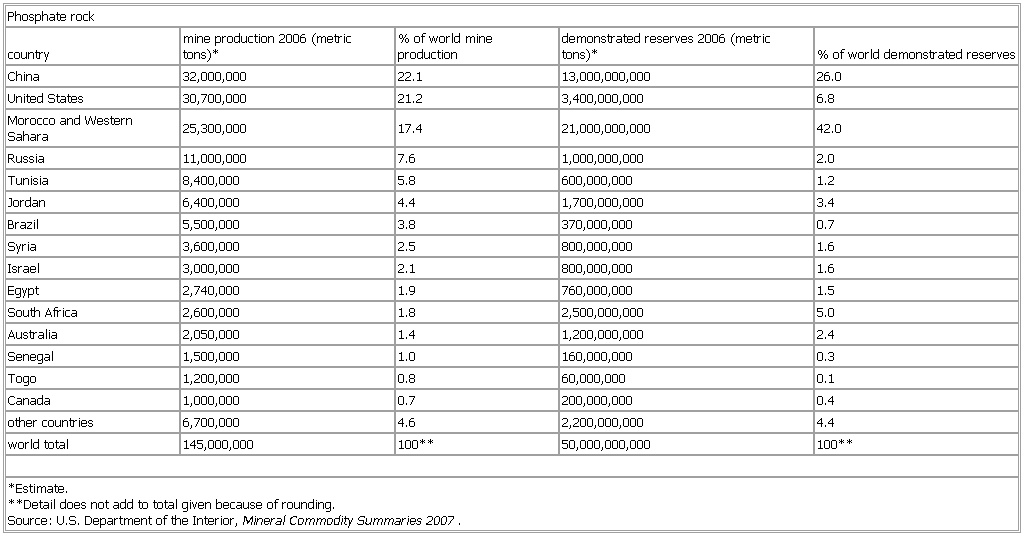
▪ TablePhosphate rockcountry mine production 2006 (metric tons)* % of world mine production demonstrated reserves 2006 (metric tons)* % of world demonstrated reservesChina 32,000,000 22.1 13,000,000,000 26.0United States 30,700,000 21.2 3,400,000,000 6.8Morocco and Western Sahara 25,300,000 17.4 21,000,000,000 42.0Russia 11,000,000 7.6 1,000,000,000 2.0Tunisia 8,400,000 5.8 600,000,000 1.2Jordan 6,400,000 4.4 1,700,000,000 3.4Brazil 5,500,000 3.8 370,000,000 0.7Syria 3,600,000 2.5 800,000,000 1.6Israel 3,000,000 2.1 800,000,000 1.6Egypt 2,740,000 1.9 760,000,000 1.5South Africa 2,600,000 1.8 2,500,000,000 5.0Australia 2,050,000 1.4 1,200,000,000 2.4Senegal 1,500,000 1.0 160,000,000 0.3Togo 1,200,000 0.8 60,000,000 0.1Canada 1,000,000 0.7 200,000,000 0.4other countries 6,700,000 4.6 2,200,000,000 4.4world total 145,000,000 100** 50,000,000,000 100***Estimate.**Detail does not add to total given because of rounding.Source: U.S. Department of the Interior, Mineral Commodity Summaries 2007.See as table:
* * *
Universalium. 2010.
