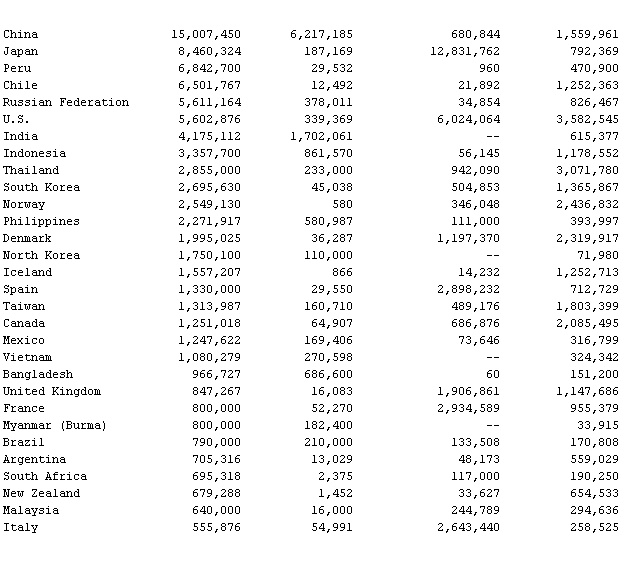
- World Fisheries, 1992, Table
-
▪ TableCatch Tradein 000 metric tons in $000Country Total Inland Imports Exports
 China 15,007,450 6,217,185 680,844 1,559,961Japan 8,460,324 187,169 12,831,762 792,369Peru 6,842,700 29,532 960 470,900Chile 6,501,767 12,492 21,892 1,252,363Russian Federation 5,611,164 378,011 34,854 826,467U.S. 5,602,876 339,369 6,024,064 3,582,545India 4,175,112 1,702,061 — 615,377Indonesia 3,357,700 861,570 56,145 1,178,552Thailand 2,855,000 233,000 942,090 3,071,780South Korea 2,695,630 45,038 504,853 1,365,867Norway 2,549,130 580 346,048 2,436,832Philippines 2,271,917 580,987 111,000 393,997Denmark 1,995,025 36,287 1,197,370 2,319,917North Korea 1,750,100 110,000 — 71,980Iceland 1,557,207 866 14,232 1,252,713Spain 1,330,000 29,550 2,898,232 712,729Taiwan 1,313,987 160,710 489,176 1,803,399Canada 1,251,018 64,907 686,876 2,085,495Mexico 1,247,622 169,406 73,646 316,799Vietnam 1,080,279 270,598 — 324,342Bangladesh 966,727 686,600 60 151,200United Kingdom 847,267 16,083 1,906,861 1,147,686France 800,000 52,270 2,934,589 955,379Myanmar (Burma) 800,000 182,400 — 33,915Brazil 790,000 210,000 133,508 170,808Argentina 705,316 13,029 48,173 559,029South Africa 695,318 2,375 117,000 190,250New Zealand 679,288 1,452 33,627 654,533Malaysia 640,000 16,000 244,789 294,636Italy 555,876 54,991 2,643,440 258,525
 World Total 98,112,800 15,578,600 45,451,914 40,275,588 {1}Excludes aquatic mammals, crocodiles and alligators, pearls, corals, sponges,and aquatic plants.Source: United Nations Food and Agriculture Organization,
 Yearbook of Fishery Statistics, vols. 74 and 75.
* * *
Universalium. 2010.
