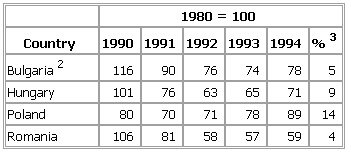
- Manufacturing Production in Eastern Europe1, Table
-
▪ TableTable II. Manufacturing Production in Eastern Europe11980 = 100Country 1990 1991 1992 1993 1994 %3Bulgaria2 116 90 76 74 78 5Hungary 101 76 63 65 71 9Poland 80 70 71 78 89 14Romania 106 81 58 57 59 4See as table:
 1 Former Czechoslovakia and former Soviet Union not available.2 All industries.3 % change, latest year shown from previous year.Source: UN, Monthly Bulletin of Statistics.
* * *
Universalium. 2010.
