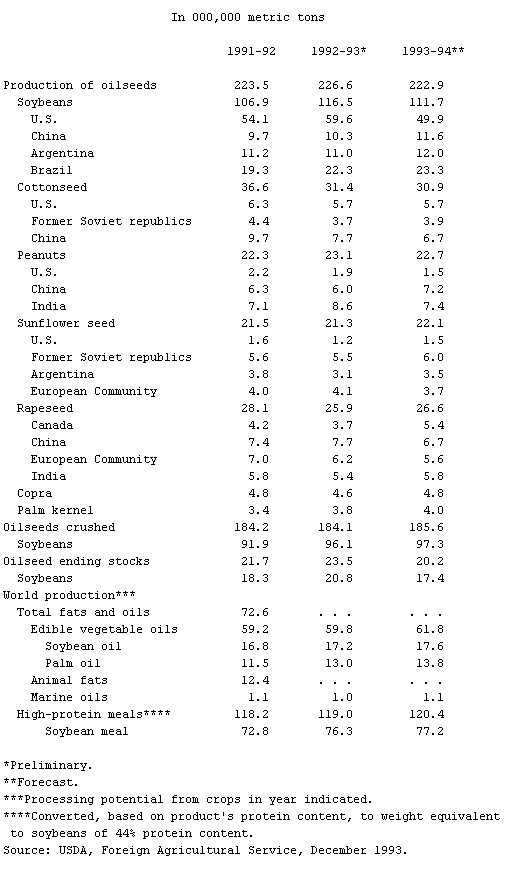
World Production of Oilseeds and Products, Table
- World Production of Oilseeds and Products, Table
-
In 000,000 metric tons
1991-92 1992-93* 1993-94**
Production of oilseeds 223.5 226.6 222.9
Soybeans 106.9 116.5 111.7
U.S. 54.1 59.6 49.9
China 9.7 10.3 11.6
Argentina 11.2 11.0 12.0
Brazil 19.3 22.3 23.3
Cottonseed 36.6 31.4 30.9
U.S. 6.3 5.7 5.7
Former Soviet republics 4.4 3.7 3.9
China 9.7 7.7 6.7
Peanuts 22.3 23.1 22.7
U.S. 2.2 1.9 1.5
China 6.3 6.0 7.2
India 7.1 8.6 7.4
Sunflower seed 21.5 21.3 22.1
U.S. 1.6 1.2 1.5
Former Soviet republics 5.6 5.5 6.0
Argentina 3.8 3.1 3.5
European Community 4.0 4.1 3.7
Rapeseed 28.1 25.9 26.6
Canada 4.2 3.7 5.4
China 7.4 7.7 6.7
European Community 7.0 6.2 5.6
India 5.8 5.4 5.8
Copra 4.8 4.6 4.8
Palm kernel 3.4 3.8 4.0
Oilseeds crushed 184.2 184.1 185.6
Soybeans 91.9 96.1 97.3
Oilseed ending stocks 21.7 23.5 20.2
Soybeans 18.3 20.8 17.4
World production***
Total fats and oils 72.6 . . . . . .
Edible vegetable oils 59.2 59.8 61.8
Soybean oil 16.8 17.2 17.6
Palm oil 11.5 13.0 13.8
Animal fats 12.4 . . . . . .
Marine oils 1.1 1.0 1.1
High-protein meals**** 118.2 119.0 120.4
Soybean meal 72.8 76.3 77.2
*Preliminary.
**Forecast.
***Processing potential from crops in year indicated.
****Converted, based on product's protein content, to weight equivalent
to soybeans of 44% protein content.
* * *
Universalium.
2010.
Look at other dictionaries:
World Production of Major Oilseeds and Products, Table 2 — ▪ Table Table IV. World Production of Major Oilseeds and Products In 000,000 metric tons 1994–95 1995–961 1996–972 Total production of oilseeds 260.7 255.4 256.3 Soybeans… … Universalium
World Production of Major Oilseeds and Products, Table 3 — ▪ Table Table IV. World Production of Major Oilseeds and Products In 000,000 metric tons 1995 96 1996 971 1997 982 Total production of oilseeds 256.4 258.7 279.9 Soybeans 125.0 131.2 149.2 U.S. 59.2 64.8 74.5 China 3.5 … Universalium
World Production of Major Oilseeds and Products, Table — ▪ 2000 Table III. World Production of Major Oilseeds and Products In 000,000 metric tons 1996 97 1997 98 1998 991 1999 20002 Total production of oilseeds 262.0 287.0 293.6 296.9 Soybeans 132.2 158.1 158.9 154.1 U.S. 64.8 73.2 74.6… … Universalium
World Production of Major Oilseeds and Products, Table 1 — ▪ Table In 000,000 metric tons 1993 94 1994 95{1} 1995 96{2} Total production of oilseeds 227.4 259.4 253.2 Soybeans 117.4 136.7 124.5 U.S. 50.9 68.5 59.4 China 15.3 16.0 14.5 Argentina 12.3 12.2 12.5 Brazil 24.7 25.5 23.3 Cottonseed 2 … Universalium
Agriculture and Food Supplies — ▪ 2007 Introduction Bird flu reached Europe and Africa, and concerns over BSE continued to disrupt trade in beef. An international vault for seeds was under construction on an Arctic island. Stocks of important food fish species were reported… … Universalium
Agriculture and Fisheries — ▪ 2002 Introduction National and International Issues Food Production. Selected Indexes of World Agricultural and Food ProductionTotal agricultural and food production increased slightly in 2001, while global per capita food production was … Universalium
Andaman and Nicobar Islands — Infobox Indian Jurisdiction type = union territory state name = Andaman and Nicobar Islands native name = Andaman and Nicobar Islands base base map label = no capital = Port Blair largest city = Port Blair latd = 11.68 longd = 92.77 abbreviation … Wikipedia
Vegetable fats and oils — Vegetable oil redirects here. For other uses, see Vegetable oil (disambiguation). Plant oils Olive oil Types Vegetable fats (list) … Wikipedia
Peanut — For other uses, see Peanut (disambiguation). Peanut Scientific classification Kingdom: Plantae (unranked) … Wikipedia
Economy of the People's Republic of China — Economies of Special Administrative Regions of Hong Kong and Macau are administered separately from the rest of People s Republic of China. Therefore, the information below pertains only to mainland China unless specified otherwise. For the… … Wikipedia

