- Iron ore
-
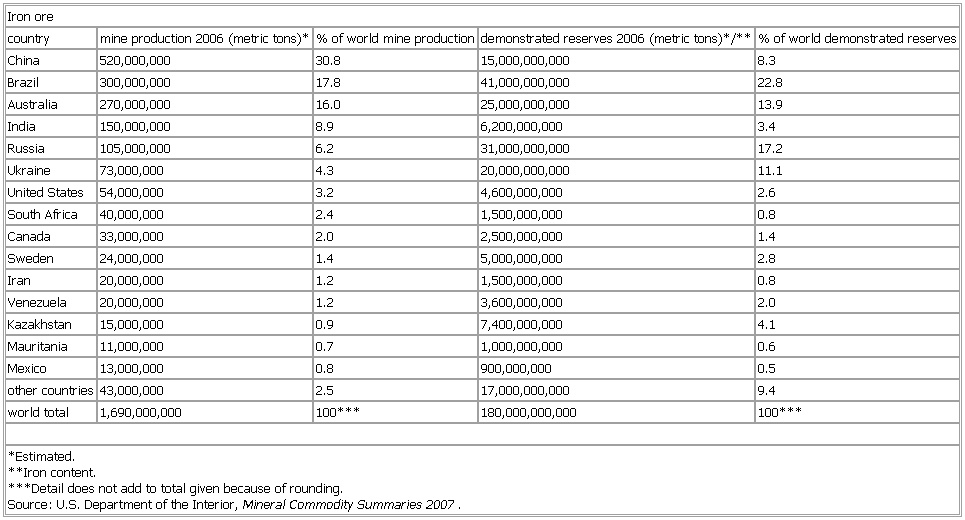
▪ TableIron orecountry mine production 2006 (metric tons)* % of world mine production demonstrated reserves 2006 (metric tons)*/** % of world demonstrated reservesChina 520,000,000 30.8 15,000,000,000 8.3Brazil 300,000,000 17.8 41,000,000,000 22.8Australia 270,000,000 16.0 25,000,000,000 13.9India 150,000,000 8.9 6,200,000,000 3.4Russia 105,000,000 6.2 31,000,000,000 17.2Ukraine 73,000,000 4.3 20,000,000,000 11.1United States 54,000,000 3.2 4,600,000,000 2.6South Africa 40,000,000 2.4 1,500,000,000 0.8Canada 33,000,000 2.0 2,500,000,000 1.4Sweden 24,000,000 1.4 5,000,000,000 2.8Iran 20,000,000 1.2 1,500,000,000 0.8Venezuela 20,000,000 1.2 3,600,000,000 2.0Kazakhstan 15,000,000 0.9 7,400,000,000 4.1Mauritania 11,000,000 0.7 1,000,000,000 0.6Mexico 13,000,000 0.8 900,000,000 0.5other countries 43,000,000 2.5 17,000,000,000 9.4world total 1,690,000,000 100*** 180,000,000,000 100****Estimated.**Iron content.***Detail does not add to total given because of rounding.Source: U.S. Department of the Interior, Mineral Commodity Summaries 2007.See as table:

* * *
Universalium. 2010.
