- World Production of Major Oilseeds and Products, Table
-
▪ 2000Table III. World Production of Major Oilseeds and ProductsIn 000,000 metric tons1996-97 1997-98 1998-991 1999-20002Total production of oilseeds 262.0 287.0 293.6 296.9Soybeans 132.2 158.1 158.9 154.1U.S. 64.8 73.2 74.6 72.8China 13.2 14.7 15.0 14.0Argentina 11.2 19.2 19.9 18.5Brazil 26.8 31.5 31.0 31.0Cottonseed 34.4 35.1 32.8 33.8U.S. 6.5 6.3 4.9 5.8Former Soviet republics 2.8 3.1 2.8 3.2China 7.6 8.3 8.1 7.4Peanuts 28.5 26.6 28.9 27.8U.S. 1.7 1.8 1.8 1.7China 10.1 9.7 11.9 12.3India 8.2 7.6 7.4 6.0Sunflower seed 23.9 23.3 25.9 26.9U.S. 1.6 1.7 2.4 2.3Former Soviet republics 5.2 5.4 5.6 6.8Argentina 5.4 5.5 6.8 6.4European Union 3.9 4.1 3.4 3.2Rapeseed 31.6 33.4 36.7 42.7Canada 5.1 6.4 7.6 8.8China 9.2 9.6 8.3 9.8European Union 7.1 8.8 9.5 11.3India 6.9 4.9 5.8 6.0Copra 6.1 5.4 4.7 5.4Palm kernel 5.2 5.1 5.8 6.1Oilseeds crushed 219.2 227.5 238.0 246.2Soybeans 115.4 126.0 133.0 133.3Oilseed ending stocks 17.1 24.8 28.3 27.6Soybeans 13.5 21.6 24.0 22.5World production3Vegetable and marine oils 75.9 76.5 81.7 85.6Edible vegetable oils 74.7 75.6 80.6 84.4Soybean oil 20.7 22.8 24.2 24.2Palm oil 17.7 17.1 19.3 20.6Marine oils 1.2 0.9 1.1 1.2High-protein meals4 149.7 155.1 163.0 168.2Soybean meal 91.7 100.2 105.2 105.9Fish meal 6.8 5.0 5.8 6.1See as table:
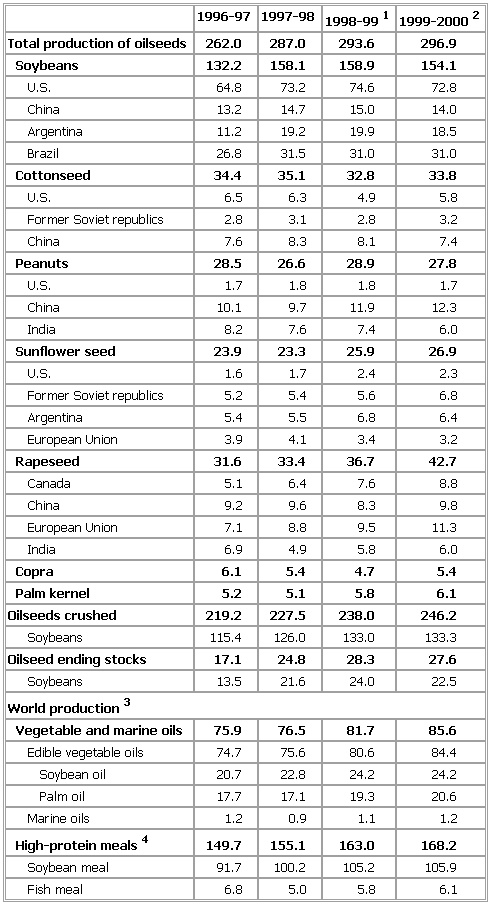 1Preliminary.2Forecast.3Processing potential from crops in the year indicated.4Converted on the basis of product's protein content,to weight equivalent of soybeans 44% protein content.Source: U.S. Department of Agriculture, December 1999.▪ 1999Table IV. World Production of Major Oilseeds and ProductsIn 000,000 metric tons1996-97 1997-981 1998-992Total production of oilseeds 261.2 287.1 290.8Soybeans 131.7 156.2 154.1U.S. 64.8 73.6 75.2China 13.2 14.7 13.5Argentina 11.2 18.7 17.0Brazil 26.8 31.0 29.0Cottonseed 34.4 34.7 32.5U.S. 6.5 6.3 4.6Former Soviet republics 2.8 3.1 2.8China 7.6 8.3 7.4Peanuts 28.4 26.7 27.6U.S. 1.7 1.6 1.7China 10.1 9.6 10.2India 8.2 7.6 7.9Sunflower seed 23.9 23.9 26.2U.S. 1.6 1.7 2.1Former Soviet republics 5.2 5.5 5.4Argentina 5.2 5.5 6.7European Union 3.9 4.1 3.8Rapeseed 31.6 33.3 36.8Canada 5.1 6.4 7.6China 9.2 9.6 8.3European Union 7.1 8.6 9.5India 6.9 4.9 6.1Copra 5.8 5.6 5.4Palm kernel 5.3 5.2 5.4Oilseeds crushed 218.9 228.9 235.5Soybeans 115.5 126.9 128.3Oilseed ending stocks 16.4 22.2 25.4Soybeans 12.9 19.2 22.2World production3Total fats and oils 89.0 89.6 93.1Edible vegetable oils 74.5 75.4 78.6Soybean oil 20.7 23.0 23.4Palm oil 17.6 16.9 17.7Animal fats 13.3 13.3 13.2Marine oils 1.2 0.9 1.3High-protein meals4 149.3 155.8 161.1Soybean meal 91.8 100.8 102.4Fish meal 6.4 5.1 6.4See as table:
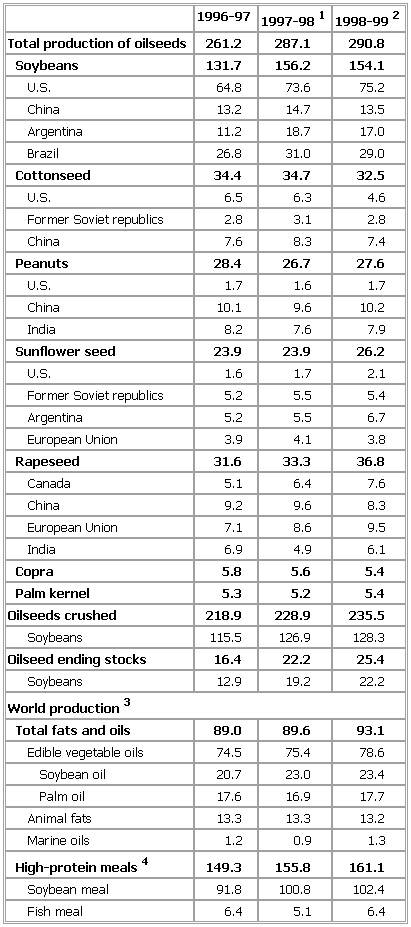 1Preliminary.2Forecast.3Processing potential from crops in the year indicated.4Converted, on the basis of product's protein content,to weight equivalent of soybeans of 44% protein content.Source: U.S. Department of Agriculture, December 1998.
* * *
▪ TableIn 000,000 metric tons1992-93 1993-94{1} 1994-95{2}Production of oilseeds 227.3 226.9 251.3Soybeans 117.1 116.6 132.9U.S. 59.6 50.9 68.7China 10.3 15.3 13.8Argentina 11.4 11.7 12.4Brazil 22.5 24.5 24.0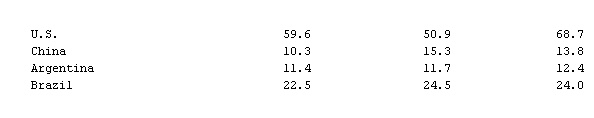 Cottonseed 31.6 29.5 32.8 U.S. 5.7 5.8 6.9Former Soviet republics 3.7 3.8 3.8China 7.7 6.4 7.7
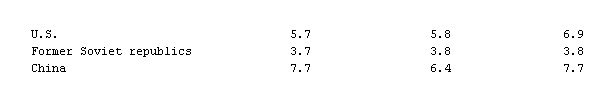 Peanuts 23.1 24.0 24.5 U.S. 1.9 1.5 1.9China 6.0 8.4 7.3India 8.6 7.6 8.8
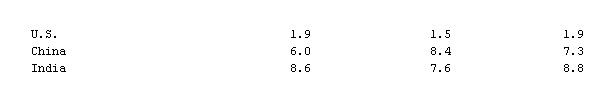 Sunflower seed 21.3 21.0 22.4 U.S. 1.2 1.2 2.1Former Soviet republics 5.5 5.3 4.7Argentina 3.1 3.8 3.7European Union 4.1 3.4 4.2
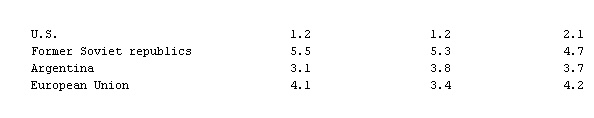 Rapeseed 25.3 26.8 29.4 Canada 3.7 5.5 7.2China 7.7 6.9 7.4European Union 6.1 5.9 6.4India 5.4 5.5 5.4
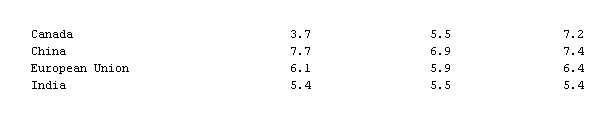 Copra 4.8 4.8 5.0 Palm kernel 4.0 4.3 4.3Oilseeds crushed 183.6 186.8 197.6Soybeans 96.2 99.7 104.9Oilseed ending stocks 23.2 19.6 28.8Soybeans 20.2 17.0 24.9World production{3}Total fats and oils ... ... ...Edible vegetable oils 59.6 61.2 64.4Soybean oil 17.1 17.9 19.0Palm oil 13.0 13.4 13.8Animal fats ... ... ...Marine oils 1.2 1.2 1.2
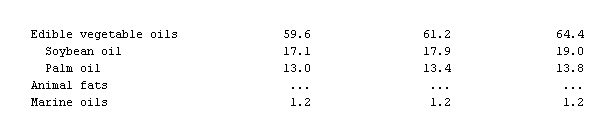 High-protein meals{4} 124.2 127.9 135.1 Soybean meal 75.8 76.9 83.0Fish meal 5.9 6.2 6.4{1}Preliminary.{2}Forecast.{3}Processing potential from crops in year indicated.{4}Converted, based on product's protein content, to weight equivalent of soybeans of44% protein content.
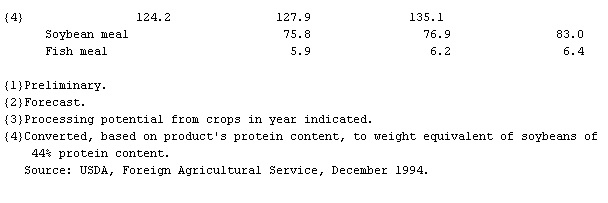
* * *
Universalium. 2010.