- World Cocoa Bean Production, Table
-
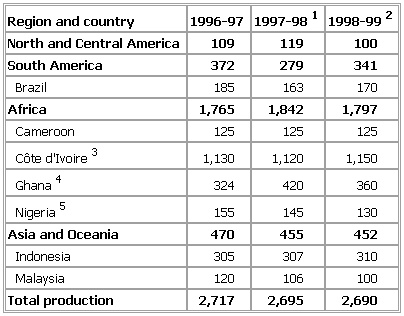
▪ 1999Table IX. World Cocoa Bean ProductionIn 000,000 metric tonsRegion and country 1996-97 1997-981 1998-992North and Central America 109 119 100South America 372 279 341Brazil 185 163 170Africa 1,765 1,842 1,797Cameroon 125 125 125Côte d'Ivoire3 1,130 1,120 1,150Ghana4 324 420 360Nigeria5 155 145 130Asia and Oceania 470 455 452Indonesia 305 307 310Malaysia 120 106 100Total production 2,717 2,695 2,690See as table:
 1Preliminary.2Forecast.3Includes some cocoa marketed from Ghana.4Includes some cocoa marketed from Côte d'Ivoire.5Includes cocoa marketed through Benin.Source: U.S. Department of Agriculture, October 1998.
* * *
▪ TableIn 000 metric tonsRegion and country 1993-94 1994-95 1995-96{1}North and Central America 111 113 116South America 451 405 451 Brazil 281 234 276Ecuador 80 81 85
 Africa 1,423 1,475 1,540 Cameroon 105 100 100Côte d'lvoire{2} 850 905 970Ghana 312 315 315Nigeria{3} 130 130 130
 Asia and Oceania 541 496 492 Indonesia 280 280 290Malaysia 204 162 150
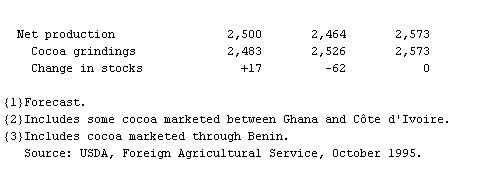
 Total production 2,525 2,489 2,599 Net production 2,500 2,464 2,573Cocoa grindings 2,483 2,526 2,573Change in stocks +17 -62 0{1}Forecast.{2}Includes some cocoa marketed between Ghana and Côte d'Ivoire.{3}Includes cocoa marketed through Benin.
* * *
Universalium. 2010.
